a) Draw a scatterplot for the data and comment. b) Determine the relationship between the workers' experience and time taken to produce an item. Hence, estimate how long a worker with 10 months experience will take to produce an item. c) If the company would like an item to be produced within 22 minutes, advise how much experience workers need. d) Calculate the Pearson's correlation coefficient and discuss its value. e) Calculate and interpret the coefficient of determination.
a) Draw a scatterplot for the data and comment. b) Determine the relationship between the workers' experience and time taken to produce an item. Hence, estimate how long a worker with 10 months experience will take to produce an item. c) If the company would like an item to be produced within 22 minutes, advise how much experience workers need. d) Calculate the Pearson's correlation coefficient and discuss its value. e) Calculate and interpret the coefficient of determination.
MATLAB: An Introduction with Applications
6th Edition
ISBN:9781119256830
Author:Amos Gilat
Publisher:Amos Gilat
Chapter1: Starting With Matlab
Section: Chapter Questions
Problem 1P
Related questions
Question

Transcribed Image Text:3 You have observed 10 workers on the shop floor and have timed how long it takes each to
produce an item. You have been able to match these times with the length of the workers
experience. The results are:
Worker
Experience
(months)
Time taken
(minutes)
27
2
26
30
3
3.
4
8
20
22
6.
9.
20
7
12
16
8.
16
15
9.
30
10
6.
19
a) Draw a scatterplot for the data and comment.
b) Determine the relationship between the workers' experience and time taken to produce an
item. Hence, estimate how long a worker with 10 months experience will take to produce
an item.
c) If the company would like an item to be produced within 22 minutes, advise how much
experience workers need.
d) Calculate the Pearson's correlation coefficient and discuss its value.
e) Calculate and interpret the coefficient of determination.
Expert Solution
Step 1
Solution:
Let,
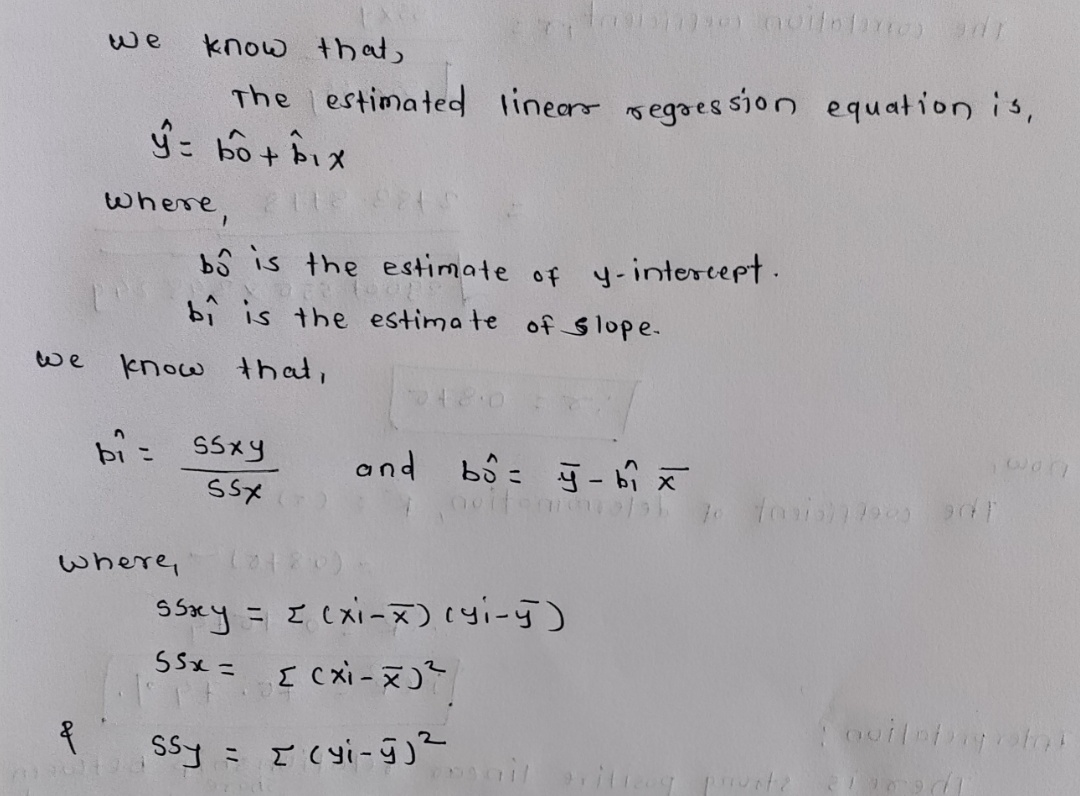
Y=The time taken to produce an item (in minutes)
X=The length of workers experience ( in months)

Step by step
Solved in 6 steps with 6 images

Recommended textbooks for you

MATLAB: An Introduction with Applications
Statistics
ISBN:
9781119256830
Author:
Amos Gilat
Publisher:
John Wiley & Sons Inc

Probability and Statistics for Engineering and th…
Statistics
ISBN:
9781305251809
Author:
Jay L. Devore
Publisher:
Cengage Learning

Statistics for The Behavioral Sciences (MindTap C…
Statistics
ISBN:
9781305504912
Author:
Frederick J Gravetter, Larry B. Wallnau
Publisher:
Cengage Learning

MATLAB: An Introduction with Applications
Statistics
ISBN:
9781119256830
Author:
Amos Gilat
Publisher:
John Wiley & Sons Inc

Probability and Statistics for Engineering and th…
Statistics
ISBN:
9781305251809
Author:
Jay L. Devore
Publisher:
Cengage Learning

Statistics for The Behavioral Sciences (MindTap C…
Statistics
ISBN:
9781305504912
Author:
Frederick J Gravetter, Larry B. Wallnau
Publisher:
Cengage Learning

Elementary Statistics: Picturing the World (7th E…
Statistics
ISBN:
9780134683416
Author:
Ron Larson, Betsy Farber
Publisher:
PEARSON

The Basic Practice of Statistics
Statistics
ISBN:
9781319042578
Author:
David S. Moore, William I. Notz, Michael A. Fligner
Publisher:
W. H. Freeman

Introduction to the Practice of Statistics
Statistics
ISBN:
9781319013387
Author:
David S. Moore, George P. McCabe, Bruce A. Craig
Publisher:
W. H. Freeman