A consumer products testing group is evaluating two competing brands of tires, Brand 1 and Brand 2. Though the two brands have been comparable in the past, some technological advances were recently made in the Brand 2 manufacturing process, and the consumer group is testing to see if Brand 2 will outperform Brand 1. Tread wear can vary considerably depending on the type of car, and the group is trying to eliminate this effect by installing the two brands on the same 12 cars, chosen at random. In particular, each car has one tire of each brand on its front wheels, with half of the cars chosen at random to have Brand 1 on the left front wheel, and the rest to have Brand 2 there. After all of the cars are driven over the standard test course for 20,000 miles, the amount of tread wear (in inches) is recorded, as shown in the table below. Car Brand 1 Brand 2 Difference (Brand 1 - Brand 2) Send data to calculator 1 2 34 8 0.51 0.40 0.51 0.45 0.61 0.56 0.46 0.45 9 10 (a) State the null hypothesis Ho and the alternative hypothesis H₁. Ho :O H₁ :0 (b) Determine the type of test statistic to use. Type of test statistic: (Choose one) ▼ (c) Find the value of the test statistic. (Round to three or more decimal places.) 0.61 0.62 0.62 0.46 0.33 0.51 0.55 0.36 0.58 0.56 0.53 0.39 0.52 0.59 0.37 0.43 0.18 -0.11 -0.04 0.09 0.03 0.00 -0.07 0.06 0.09 0.03 0.25 0.03 Based on these data, can the consumer group conclude, at the 0.05 level of significance, that the mean tread wear of Brand 1 exceeds that of Brand 2? Answer this question by performing a hypothesis test regarding μd (which is u with a letter "d" subscript), the population mean difference in tread wear for the two brands of tires. Assume that this population of differences (Brand 1 minus Brand 2) is normally distributed. Perform a one-tailed test. Then complete the parts below. Carry your intermediate computations to three or more decimal places and round your answers as specified. (If necessary, consult a list of formulas.) 12 (d) Find the critical value at the 0.05 level of significance. (Round to three or more decimal places.) (e) At the 0.05 level, can the consumer group conclude that the mean tread wear of Brand 1 exceeds that of Brand 2? OYes No μ X a X S 8 0#0 OO
A consumer products testing group is evaluating two competing brands of tires, Brand 1 and Brand 2. Though the two brands have been comparable in the past, some technological advances were recently made in the Brand 2 manufacturing process, and the consumer group is testing to see if Brand 2 will outperform Brand 1. Tread wear can vary considerably depending on the type of car, and the group is trying to eliminate this effect by installing the two brands on the same 12 cars, chosen at random. In particular, each car has one tire of each brand on its front wheels, with half of the cars chosen at random to have Brand 1 on the left front wheel, and the rest to have Brand 2 there. After all of the cars are driven over the standard test course for 20,000 miles, the amount of tread wear (in inches) is recorded, as shown in the table below. Car Brand 1 Brand 2 Difference (Brand 1 - Brand 2) Send data to calculator 1 2 34 8 0.51 0.40 0.51 0.45 0.61 0.56 0.46 0.45 9 10 (a) State the null hypothesis Ho and the alternative hypothesis H₁. Ho :O H₁ :0 (b) Determine the type of test statistic to use. Type of test statistic: (Choose one) ▼ (c) Find the value of the test statistic. (Round to three or more decimal places.) 0.61 0.62 0.62 0.46 0.33 0.51 0.55 0.36 0.58 0.56 0.53 0.39 0.52 0.59 0.37 0.43 0.18 -0.11 -0.04 0.09 0.03 0.00 -0.07 0.06 0.09 0.03 0.25 0.03 Based on these data, can the consumer group conclude, at the 0.05 level of significance, that the mean tread wear of Brand 1 exceeds that of Brand 2? Answer this question by performing a hypothesis test regarding μd (which is u with a letter "d" subscript), the population mean difference in tread wear for the two brands of tires. Assume that this population of differences (Brand 1 minus Brand 2) is normally distributed. Perform a one-tailed test. Then complete the parts below. Carry your intermediate computations to three or more decimal places and round your answers as specified. (If necessary, consult a list of formulas.) 12 (d) Find the critical value at the 0.05 level of significance. (Round to three or more decimal places.) (e) At the 0.05 level, can the consumer group conclude that the mean tread wear of Brand 1 exceeds that of Brand 2? OYes No μ X a X S 8 0#0 OO

MATLAB: An Introduction with Applications
6th Edition
ISBN:9781119256830
Author:Amos Gilat
Publisher:Amos Gilat
Chapter1: Starting With Matlab
Section: Chapter Questions
Problem 1P

Related questions
Question

Transcribed Image Text:A consumer products testing group is evaluating two competing brands of tires, Brand 1 and Brand 2. Though the two brands have been comparable in the past,
some technological advances were recently made in the Brand 2 manufacturing process, and the consumer group is testing to see if Brand 2 will outperform
Brand 1. Tread wear can vary considerably depending on the type of car, and the group is trying to eliminate this effect by installing the two brands on the same
12 cars, chosen at random. In particular, each car has one tire of each brand on its front wheels, with half of the cars chosen at random to have Brand 1 on the
left front wheel, and the rest to have Brand 2 there. After all of the cars are driven over the standard test course for 20,000 miles, the amount of tread wear (in
inches) is recorded, as shown in the table below.
Car
Brand 1
Brand 2
Difference
(Brand 1 - Brand 2)
Send data to calculator
1
0.51 0.40
0.33
0.51
4
5
6
78
H₁ :0
(b) Determine the type of test statistic to use.
Type of test statistic: (Choose one)
0.45 0.61 0.56 0.46 0.45 0.61
0.51 0.55 0.36 0.58 0.56 0.53 0.39
89
(a) State the null hypothesis H. and the alternative hypothesis H₁.
H₂O
0
0.52
(c) Find the value of the test statistic. (Round to three or more decimal places.)
0
10
0.18 0.11 -0.04 0.09 0.03 0.00 -0.07 0.06 0.09 0.03 0.25 0.03
Based on these data, can the consumer group conclude, at the 0.05 level of significance, that the mean tread wear of Brand 1 exceeds that of Brand 2? Answer
this question by performing a hypothesis test regarding μ (which is μ with a letter "d" subscript), the population mean difference in tread wear for the two
brands of tires. Assume that this population of differences (Brand 1 minus Brand 2) is normally distributed.
0.62 0.62 0.46
Perform a one-tailed test. Then complete the parts below. Carry your intermediate computations to three or more decimal places and round your answers as
specified. (If necessary, consult a list of formulas.)
0.59 0.37 0.43
(e) At the 0.05 level, can the consumer group conclude that the mean tread wear of Brand 1
exceeds that of Brand 2?
O Yes O No
(d) Find the critical value at the 0.05 level of significance. (Round to three or more decimal places.)
0
12
μ
XI
☐#0
X
O
0=0 OSO
S
O<O
Р
Ś
<Q
0|0
□<口
Expert Solution
Step 1
Given that
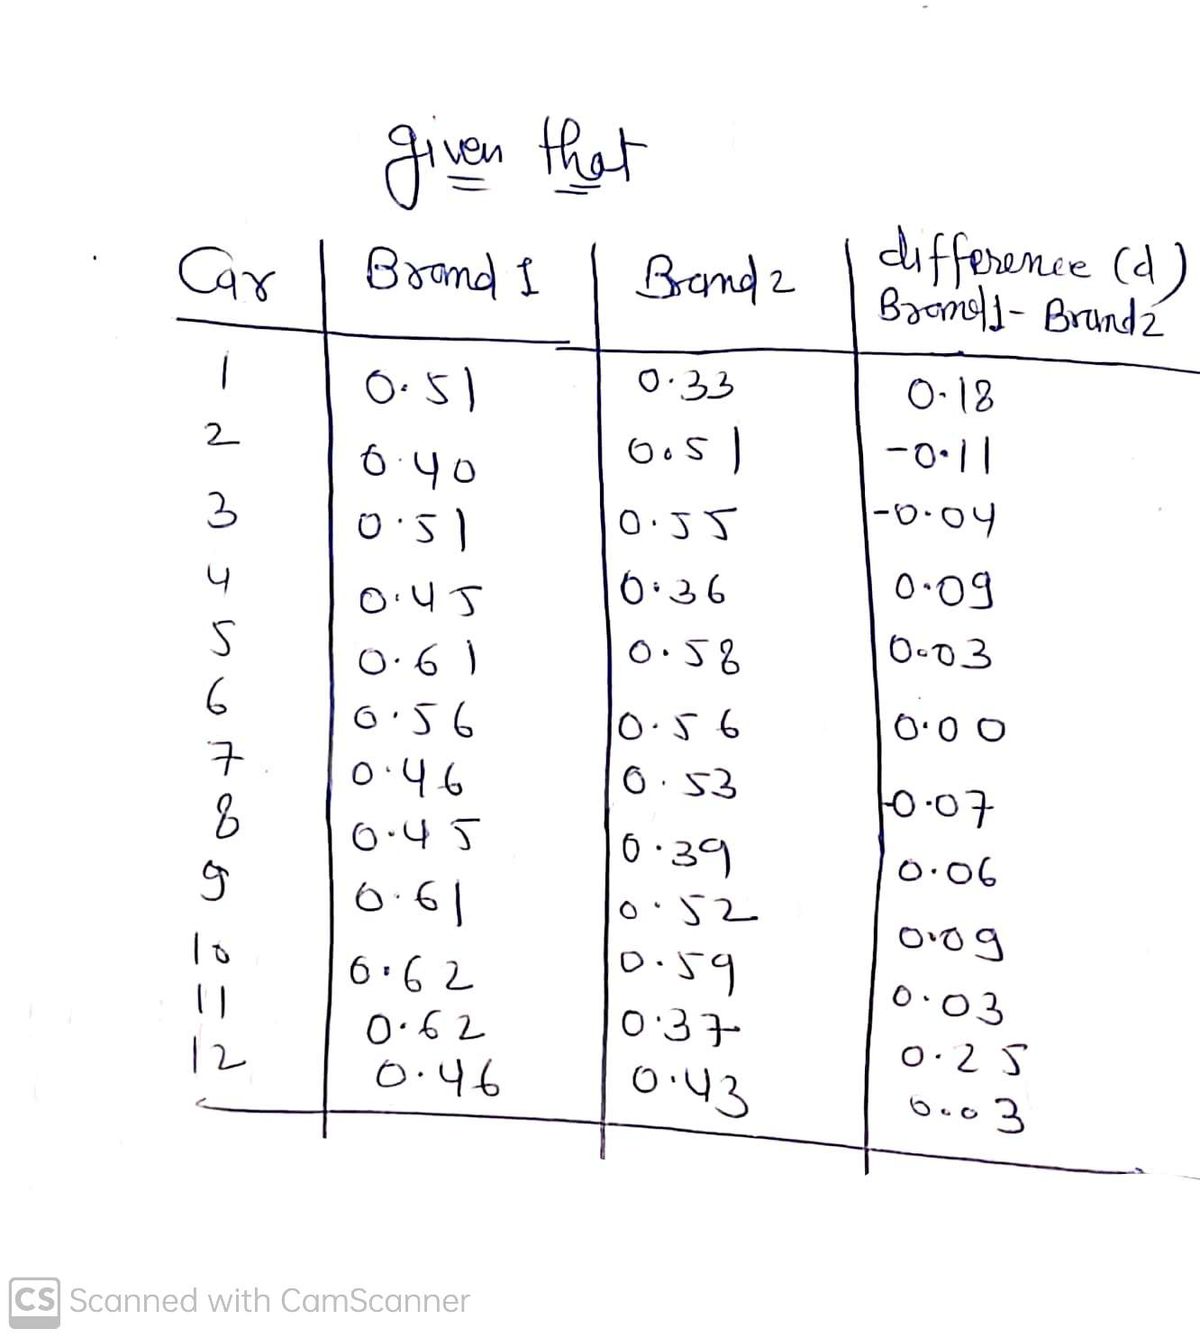
We have to test hypothesis for the claim that the consumer group conclude that the mean tread wear of Brand 1 exceeds that of Brand 2 at 0.05 level of significance

Step by step
Solved in 4 steps with 2 images

Recommended textbooks for you
MATLAB: An Introduction with Applications
Statistics
ISBN:
9781119256830
Author:
Amos Gilat
Publisher:
John Wiley & Sons Inc

Probability and Statistics for Engineering and th…
Statistics
ISBN:
9781305251809
Author:
Jay L. Devore
Publisher:
Cengage Learning

Statistics for The Behavioral Sciences (MindTap C…
Statistics
ISBN:
9781305504912
Author:
Frederick J Gravetter, Larry B. Wallnau
Publisher:
Cengage Learning
MATLAB: An Introduction with Applications
Statistics
ISBN:
9781119256830
Author:
Amos Gilat
Publisher:
John Wiley & Sons Inc
Probability and Statistics for Engineering and th…
Statistics
ISBN:
9781305251809
Author:
Jay L. Devore
Publisher:
Cengage Learning
Statistics for The Behavioral Sciences (MindTap C…
Statistics
ISBN:
9781305504912
Author:
Frederick J Gravetter, Larry B. Wallnau
Publisher:
Cengage Learning

Elementary Statistics: Picturing the World (7th E…
Statistics
ISBN:
9780134683416
Author:
Ron Larson, Betsy Farber
Publisher:
PEARSON

The Basic Practice of Statistics
Statistics
ISBN:
9781319042578
Author:
David S. Moore, William I. Notz, Michael A. Fligner
Publisher:
W. H. Freeman

Introduction to the Practice of Statistics
Statistics
ISBN:
9781319013387
Author:
David S. Moore, George P. McCabe, Bruce A. Craig
Publisher:
W. H. Freeman