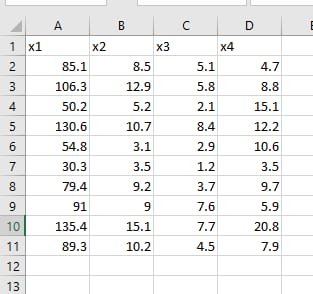
A motion picture industry analyst is studying movies based on epic novels. The following data were obtained for 10 Hollywood movies made in the past five years. Each movie was based on an epic novel. For these data, x1 = first-year box office receipts of the movie, x2 = total production costs of the movie, x3 = tota
A motion picture industry analyst is studying movies based on epic novels. The following data were obtained for 10 Hollywood movies made in the past five years. Each movie was based on an epic novel. For these data, x1 = first-year box office receipts of the movie, x2 = total production costs of the movie, x3 = total promotional costs of the movie, and x4 = total book sales prior to movie release. All units are in millions of dollars.
| x1 | x2 | x3 | x4 |
| 85.1 | 8.5 | 5.1 | 4.7 |
| 106.3 | 12.9 | 5.8 | 8.8 |
| 50.2 | 5.2 | 2.1 | 15.1 |
| 130.6 | 10.7 | 8.4 | 12.2 |
| 54.8 | 3.1 | 2.9 | 10.6 |
| 30.3 | 3.5 | 1.2 | 3.5 |
| 79.4 | 9.2 | 3.7 | 9.7 |
| 91.0 | 9.0 | 7.6 | 5.9 |
| 135.4 | 15.1 | 7.7 | 20.8 |
| 89.3 | 10.2 | 4.5 | 7.9 |
a) Find a 90% confidence interval for each coefficient. (Use 2 decimal places.)
| lower limit | upper limit | |
| ?2 | ||
| ?3 | ||
| ?4 |
b) Suppose a new movie (based on an epic novel) has just been released. Production costs were x2 = 11.4 million; promotion costs were x3 = 4.7 million; book sales were x4 = 8.1 million. Make a prediction for x1 = first-year box office receipts and find an 85% confidence interval for your prediction (if your software supports prediction intervals). (Use 1 decimal place.)
| prediction= | _______ |
| lower limit= | _______ |
| upper limit= | ______ |
Tabulate data in excel

Step by step
Solved in 4 steps with 4 images


