3. The police department is assessing its staffing requirements. The department expects that the number of serious crimes committed, C, on average each week is proportional to the number of officers, P, on special street patrol. Data for the past year has been collected and some of it is shown below: P 4 7 9 11 15 17 C 14 11 10 9 7 5 a) Neatly sketch a scatter plot of the data on graph provided below. Which variable is the independent variable that should be plotted on the horizontal axis? Notice that the data seem to fall in a linear pattern. Draw the best-fit line through the data. Label your axes, indicate the scale, and title your graph. Why has only the first quadrant been provided for the graph? b) Look at your best-fit line and identify two good coordinate points that sit right on this best-fit line:
3. The police department is assessing its staffing requirements. The department expects that the number of serious crimes committed, C, on average each week is proportional to the number of officers, P, on special street patrol. Data for the past year has been collected and some of it is shown below: P 4 7 9 11 15 17 C 14 11 10 9 7 5 a) Neatly sketch a scatter plot of the data on graph provided below. Which variable is the independent variable that should be plotted on the horizontal axis? Notice that the data seem to fall in a linear pattern. Draw the best-fit line through the data. Label your axes, indicate the scale, and title your graph. Why has only the first quadrant been provided for the graph? b) Look at your best-fit line and identify two good coordinate points that sit right on this best-fit line:
MATLAB: An Introduction with Applications
6th Edition
ISBN:9781119256830
Author:Amos Gilat
Publisher:Amos Gilat
Chapter1: Starting With Matlab
Section: Chapter Questions
Problem 1P
Related questions
Question

Transcribed Image Text:3. The police department is assessing its staffing requirements. The department expects that the number
of serious crimes committed, C, on average each week is proportional to the number of officers, P, on
special street patrol. Data for the past year has been collected and some of it is shown below:
P
4
7
9
11
15
17
с
14
11
10
9
7
5
a) Neatly sketch a scatter plot of the data on graph provided below. Which variable is the independent
variable that should be plotted on the horizontal axis? Notice that the data seem to fall in a linear
pattern. Draw the best-fit line through the data. Label your axes, indicate the scale, and title your graph.
Why has only the first quadrant been provided for the graph?
b) Look at your best-fit line and identify two good coordinate points that sit right on this best-fit line:
Expert Solution
This question has been solved!
Explore an expertly crafted, step-by-step solution for a thorough understanding of key concepts.
Step by step
Solved in 4 steps with 4 images

Follow-up Questions
Read through expert solutions to related follow-up questions below.
Follow-up Question

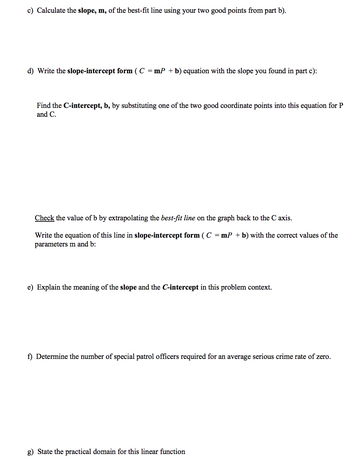
Transcribed Image Text:c) Calculate the slope, m, of the best-fit line using your two good points from part b).
d) Write the slope-intercept form ( C = mP + b) equation with the slope you found in part c):
Find the C-intercept, b, by substituting one of the two good coordinate points into this equation for P
and C.
Check the value of b by extrapolating the best-fit line on the graph back to the C axis.
Write the equation of this line in slope-intercept form ( C = mP + b) with the correct values of the
parameters m and b:
e) Explain the meaning of the slope and the C-intercept in this problem context.
f) Determine the number of special patrol officers required for an average serious crime rate of zero.
g) State the practical domain for this linear function
Solution
Recommended textbooks for you

MATLAB: An Introduction with Applications
Statistics
ISBN:
9781119256830
Author:
Amos Gilat
Publisher:
John Wiley & Sons Inc

Probability and Statistics for Engineering and th…
Statistics
ISBN:
9781305251809
Author:
Jay L. Devore
Publisher:
Cengage Learning

Statistics for The Behavioral Sciences (MindTap C…
Statistics
ISBN:
9781305504912
Author:
Frederick J Gravetter, Larry B. Wallnau
Publisher:
Cengage Learning

MATLAB: An Introduction with Applications
Statistics
ISBN:
9781119256830
Author:
Amos Gilat
Publisher:
John Wiley & Sons Inc

Probability and Statistics for Engineering and th…
Statistics
ISBN:
9781305251809
Author:
Jay L. Devore
Publisher:
Cengage Learning

Statistics for The Behavioral Sciences (MindTap C…
Statistics
ISBN:
9781305504912
Author:
Frederick J Gravetter, Larry B. Wallnau
Publisher:
Cengage Learning

Elementary Statistics: Picturing the World (7th E…
Statistics
ISBN:
9780134683416
Author:
Ron Larson, Betsy Farber
Publisher:
PEARSON

The Basic Practice of Statistics
Statistics
ISBN:
9781319042578
Author:
David S. Moore, William I. Notz, Michael A. Fligner
Publisher:
W. H. Freeman

Introduction to the Practice of Statistics
Statistics
ISBN:
9781319013387
Author:
David S. Moore, George P. McCabe, Bruce A. Craig
Publisher:
W. H. Freeman