I just need the 2 bottom ones (:

MATLAB: An Introduction with Applications
6th Edition
ISBN:9781119256830
Author:Amos Gilat
Publisher:Amos Gilat
Chapter1: Starting With Matlab
Section: Chapter Questions
Problem 1P

Related questions
Question
I just need the 2 bottom ones (:

Transcribed Image Text:An air conditioning company located in Central Florida collected data for the number of air
conaruoning units sold in the Central Florida area and for the outside temperature on the day that sales took
place. The Sales Manager put the following table together:
Outside Temperature
(Degrees F)
68
Sales
(Number of air conditioning units sold)
3
5
72
78
81
12
84
15
86
16
89
22
91
18
93
19
26
94
Plot a scatter diagram for the data provided on the table above and the linear regression line
calculated in topic (b). Consider that:
Y: number of air conditioning units sold
X: outside temperature (degrees F)
Guidance: graph should look like the one presented in Figure 4.2 of textbook
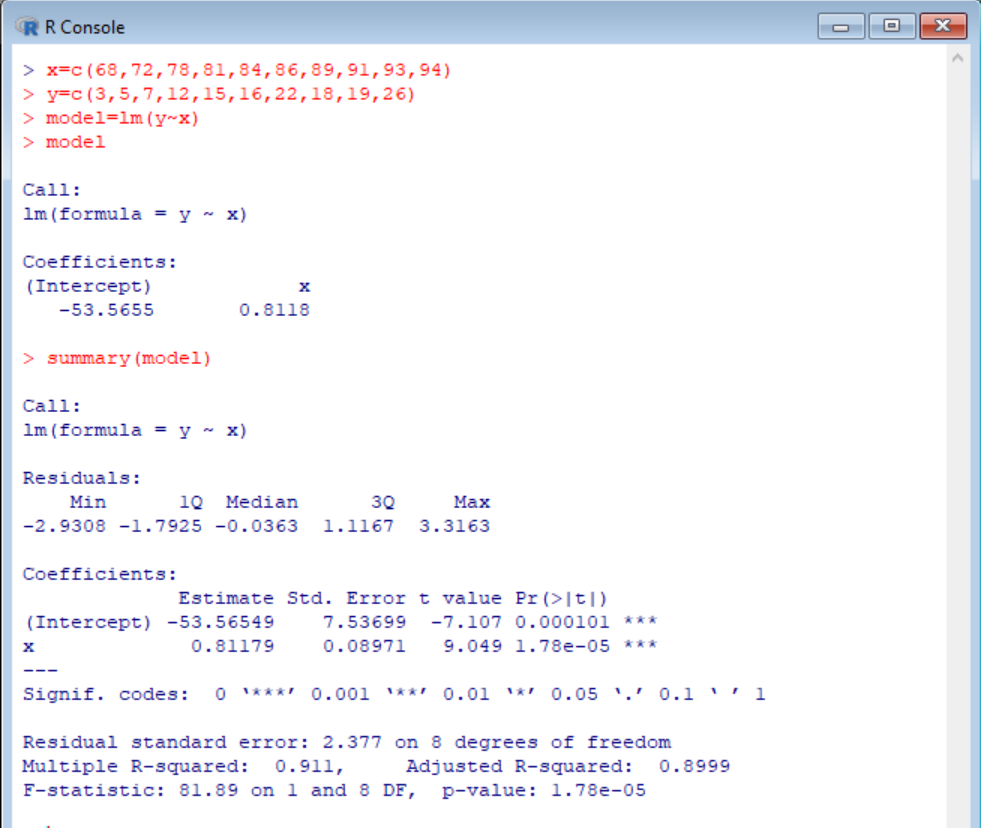
Perform the linear regression calculation and provide the linear regression equation that describes
the relationship between Y (number of air conditioning units sold) and X (outside temperature in degrees
Fahrenheit.
Guidance: follow the steps presented on Table 4.2 of textbook
, Calculate SST, SSE and SSR for this linear regression
Guidance: follow the steps presented on Table 4.3 of textbook
"Calculate the coefficient of determination (r') and the coefficient of correlation (r).
Using the linear regression equation that you developed in topic (b), calculate the estimated sales for
a day that will reach 84 degrees F and for a day that will reach 94 F and for both temperature levels calculate the
error "e" when comparing the estimated value against the actual data provided. At which of the two
temperatures, is your model more accurate? Explain.
Calculate an estimate for the variance (o') and the standard deviation for the linear regression model
you have developed.
Expert Solution
Step 1

Step by step
Solved in 3 steps with 1 images

Recommended textbooks for you
MATLAB: An Introduction with Applications
Statistics
ISBN:
9781119256830
Author:
Amos Gilat
Publisher:
John Wiley & Sons Inc

Probability and Statistics for Engineering and th…
Statistics
ISBN:
9781305251809
Author:
Jay L. Devore
Publisher:
Cengage Learning

Statistics for The Behavioral Sciences (MindTap C…
Statistics
ISBN:
9781305504912
Author:
Frederick J Gravetter, Larry B. Wallnau
Publisher:
Cengage Learning
MATLAB: An Introduction with Applications
Statistics
ISBN:
9781119256830
Author:
Amos Gilat
Publisher:
John Wiley & Sons Inc
Probability and Statistics for Engineering and th…
Statistics
ISBN:
9781305251809
Author:
Jay L. Devore
Publisher:
Cengage Learning
Statistics for The Behavioral Sciences (MindTap C…
Statistics
ISBN:
9781305504912
Author:
Frederick J Gravetter, Larry B. Wallnau
Publisher:
Cengage Learning

Elementary Statistics: Picturing the World (7th E…
Statistics
ISBN:
9780134683416
Author:
Ron Larson, Betsy Farber
Publisher:
PEARSON

The Basic Practice of Statistics
Statistics
ISBN:
9781319042578
Author:
David S. Moore, William I. Notz, Michael A. Fligner
Publisher:
W. H. Freeman

Introduction to the Practice of Statistics
Statistics
ISBN:
9781319013387
Author:
David S. Moore, George P. McCabe, Bruce A. Craig
Publisher:
W. H. Freeman