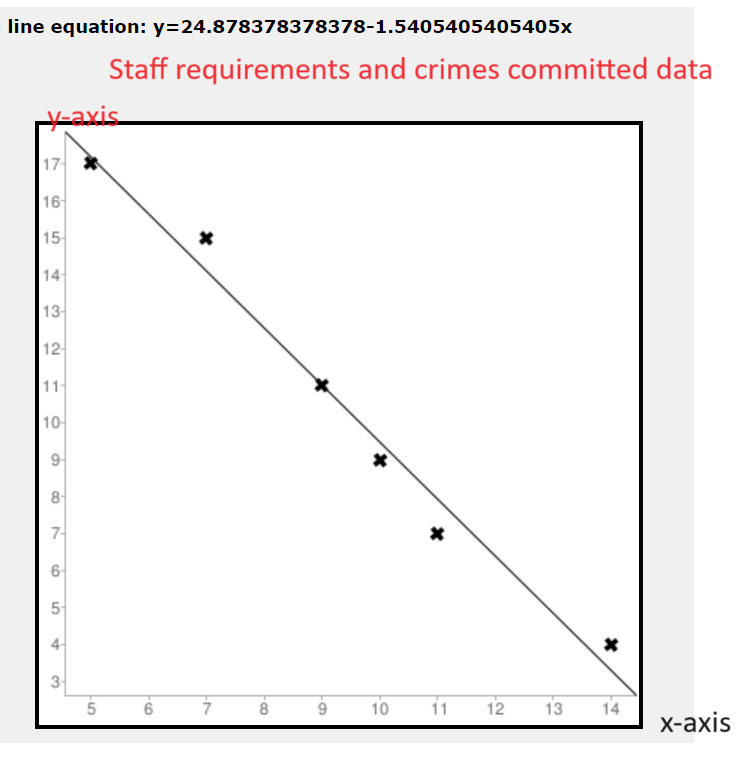
3. The police department is assessing its staffing requirements. The department expects that the numbe of serious crimes committed, C, on average each week is proportional to the number of officers, P, on special street patrol. Data for the past year has been collected and some of it is shown below: P 4 7 9 11 15 17 C 14 11 10 9 7 5 a) Neatly sketch a scatter plot of the data on graph provided below. Which variable is the independent variable that should be plotted on the horizontal axis? Notice that the data seem to fall in a linear pattern. Draw the best-fit line through the data. Label your axes, indicate the scale, and title your grap Why has only the first quadrant been provided for the graph? b) Look at your best-fit line and identify two good coordinate points that sit right on this best-fit line:
3. The police department is assessing its staffing requirements. The department expects that the numbe of serious crimes committed, C, on average each week is proportional to the number of officers, P, on special street patrol. Data for the past year has been collected and some of it is shown below: P 4 7 9 11 15 17 C 14 11 10 9 7 5 a) Neatly sketch a scatter plot of the data on graph provided below. Which variable is the independent variable that should be plotted on the horizontal axis? Notice that the data seem to fall in a linear pattern. Draw the best-fit line through the data. Label your axes, indicate the scale, and title your grap Why has only the first quadrant been provided for the graph? b) Look at your best-fit line and identify two good coordinate points that sit right on this best-fit line:

Advanced Engineering Mathematics
10th Edition
ISBN:9780470458365
Author:Erwin Kreyszig
Publisher:Erwin Kreyszig
Chapter2: Second-order Linear Odes
Section: Chapter Questions
Problem 1RQ

Related questions
Question
Please plot the graph and give the two best fit points

Transcribed Image Text:3. The police department is assessing its staffing requirements. The department expects that the number
of serious crimes committed, C, on average each week is proportional to the number of officers, P, on
special street patrol. Data for the past year has been collected and some of it is shown below:
P
4
7
9
11
15
17
с
14
11
10
9
7
5
a) Neatly sketch a scatter plot of the data on graph provided below. Which variable is the independent
variable that should be plotted on the horizontal axis? Notice that the data seem to fall in a linear
pattern. Draw the best-fit line through the data. Label your axes, indicate the scale, and title your graph.
Why has only the first quadrant been provided for the graph?
b) Look at your best-fit line and identify two good coordinate points that sit right on this best-fit line:
Expert Solution
Step 1: Part-(a)


Step by step
Solved in 5 steps with 4 images

Recommended textbooks for you
Advanced Engineering Mathematics
Advanced Math
ISBN:
9780470458365
Author:
Erwin Kreyszig
Publisher:
Wiley, John & Sons, Incorporated

Numerical Methods for Engineers
Advanced Math
ISBN:
9780073397924
Author:
Steven C. Chapra Dr., Raymond P. Canale
Publisher:
McGraw-Hill Education

Introductory Mathematics for Engineering Applicat…
Advanced Math
ISBN:
9781118141809
Author:
Nathan Klingbeil
Publisher:
WILEY
Advanced Engineering Mathematics
Advanced Math
ISBN:
9780470458365
Author:
Erwin Kreyszig
Publisher:
Wiley, John & Sons, Incorporated
Numerical Methods for Engineers
Advanced Math
ISBN:
9780073397924
Author:
Steven C. Chapra Dr., Raymond P. Canale
Publisher:
McGraw-Hill Education
Introductory Mathematics for Engineering Applicat…
Advanced Math
ISBN:
9781118141809
Author:
Nathan Klingbeil
Publisher:
WILEY

Mathematics For Machine Technology
Advanced Math
ISBN:
9781337798310
Author:
Peterson, John.
Publisher:
Cengage Learning,

