Q: Consider a competitive market where the intersection of the demand and supply curves determine the…
A: Ans : If we fit a OLS line through observed quantity-price outcomes using log quantity-log price…
Q: Does the presence of a significant interaction change the interpretation of significant main…
A:
Q: 4. The area of a circle is 72 cm². Find the area of a sector of this circle that subtends a central…
A: If the sector subtends the angle a( in radians ) at the center and area of the circle is A then The…
Q: What are the "Gauss-Markov" assumptions? Why are they important when using linear regression?
A: In this step, we discuss about the Gauss - Markov Assumptions.
Q: 15. Exercise and StressA study shows that exercise appears to offer some resiliency against stress.…
A: Part (a): Calculate the average value of HC groups: Calculate the average value of SD groups:…
Q: When looking at the matrix for a two-way ANOVA, which means (row, column, or cell means) do we look…
A: In a two-way ANOVA, to assess if there is an interaction effect we look into cell means
Q: Omega-3, finis Exercises 21 and 23 describe an experi-ment investigating the effectiveness of…
A:
Q: In a 2^6 factorial experiment how many two -factor and three-factor interaction effects are there?…
A:
Q: Suppose we are interested in the effect of gender on income and we estimate a model in which income…
A: It is required to identify the correct statement regarding a dummy variable in regression analysis.
Q: A survey of high school students was done to examine whether students had ever driven a car after…
A: Detailed explanation:To compute the odds ratio (OR) of drinking before driving for students who…
Q: A market researcher wants to determine whether a new model of a personal cormputer that had been…
A: Covariance : Covariance is a statistical method for determining the relationship between two random…
Q: The data for lab 1-2 was created based upon the paper by the STARSproject and modified by Dr. Hole.…
A: The objective of this question is to analyze the fast food dataset to answer several questions…
Q: An article in the Journal of Database Management ["Experimental Study of a Self-Tuning Algorithm for…
A: Since you have posted a question with multiple sub-parts, we will solve first 3 sub-parts for you.…
Q: Consider a two factor factorial design with two design factors A and B. The significance of each of…
A: F statistic is the ration of mean squares
Q: Why is it important to maximize the degree to which samples and data used to train or build…
A: Training and testing an algorithm are a part of machine learning.
Q: A study examining the effect of caffeine on squat and bench press 1-repitition maximum requires each…
A: In this case, the effect of caffeine on squat and bench press is measured.Each prticipant gets…
Q: Find the best least squares fit by a line to the points (-2, 1), (2,–3), (0,0), (-4,7).
A:
Q: A worker at the local Department of Motor Vehicles (DMV) claims that 60% of teenagers smile in their…
A: Solution : Given : Dot plot of 100 simulated trials assuming that 60% of teenagers smile for their…
Q: Show that for 2² factorial experiment the main effects and interactions are mutually orthogonal.
A: Answer: For the given data,
Q: You are asked to evaluate 'Introduction to the Matrix' from the statistical data of the following 7…
A: Class AClass BClass CClass DClass EClass FClass…
Q: amusement park studied methods for decreasing the waiting time (minutes) for rides by loading and…
A: cost ride_type metho 46 RC M1 48 RC M1 56 SD M1 48 SD M1 52 LF M1 48 LF M1 51 RC M2…
Q: 8 Selling electric power. Researchers for the University of Maryland Department of Civil and…
A:
Q: Both liver cells and lens cells have the genes for making the proteins albumin and crystalline.…
A:
Q: More than 10% of people carry the parasite Toxoplasma gondii. The life-long presence of Toxoplasma…
A: Given the table which shows the number of drivers who are infected and not infected. Please find the…
Q: Suppose we are collecting data for a study, and we have the data points (1, 4), (3, 5), (3, 3), and…
A: Given Data Points: (1, 4), (3, 5), (3, 3), and (5, 6).
Q: ou are asked to evaluate 'Introduction to the Matrix' from the statistical data of the following…
A: For this given dataClass A Class B Class C Class D Class E Class F Class G Mean…
Q: A study was done on the timeliness of flights categorized as either "on time" or "delayed" of two…
A: A. This is an example of Simpson's paradox. B. "City" is a lurking variable in this example.
Q: Yk μ = 8 di = = Bi - = (αβ) Specify the appropriate linear model and define each component in the…
A: Designs are usually distinguished by the way experimental units are grouped and by the way…
Q: 10+ 20 30 40 50 60 Age (years) Interpret the residual for the man indicated in the scatter plot…
A:
Q: Below is JMP output of app data from the Apple Store. Cost - Indication if the app was free or not…
A: From given Output Chi square test statistic =10.602 P-value =0.0141 Level of significance =0.005
Q: Explain in detail the approach of Weighted Least Square used by applied economists to address…
A: Solution: Here, it is needed to explain about the weighted least squares method.
Q: 14. Suppose you build a Partial Least Squares model where you prepared the data by centering and…
A: No, we cannot proceed to perform a 5-fold Cross Validation without performing additional data…
Q: A worker at the local Department of Motor Vehicles (DMV) claims that 60% of teenagers smile in their…
A: Solution: Given: Dot plot of 100 simulated trails assuming that 60% of teenagers smile for their…
Q: 4. Suppose you are interested in estimating the determinants of women's wages and you run…
A: Selection bias:-
Q: Use the data 'kielmc' and draw an histogram of log house prices. Log House price 10.0 10.5 11.0 115…
A: Hey there! Thank you for posting the question. Since there are multiple questions posted, we will…
Q: Refer to the ANOVA output below. A business researcher is investigating the process inputs that…
A: 1. True Reason : The factors under study that influence late orders are Quantity, Order Frequency,…
Q: Is the number of games won by a major league baseball team in a season related to the team's batting…
A: The least square prediction equation is, Y = a + bx
Q: Studies have shown that exposure to light at night is harmful to human health. A study in mice shows…
A: Solution: The one way ANOVA output is given.
Q: What is the p-value? Round your answer to four decimal places. p-value = i
A: (b) The total sum of square is, SSTotal=481776+177835=659611 The degrees of freedom for Groups is,…
Q: Table AMS11.2 summarizes the results.Completely analyze these data and write a report to the team…
A: For factor Media: H0: There is no difference in the mean updated times between two types of media…
Q: In an agricultural experiment using barley, the effects of various commercial fertilizers and…
A: Solution Enter data in Minitab and click on Stat->Anova->General Linear model Move Yields to…
Q: The textbook suggests an "entity-demeaned" procedure to avoid having to specify a potentially large…
A:
Q: A researcher conducted a 2-factor ANOVA on the data from his experiment and found a significant main…
A: In this case, it is obtained that there are significant main effects due to factor A and B.
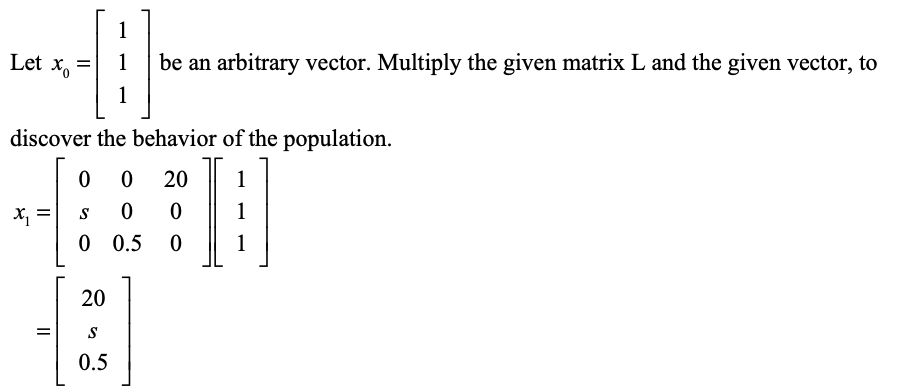
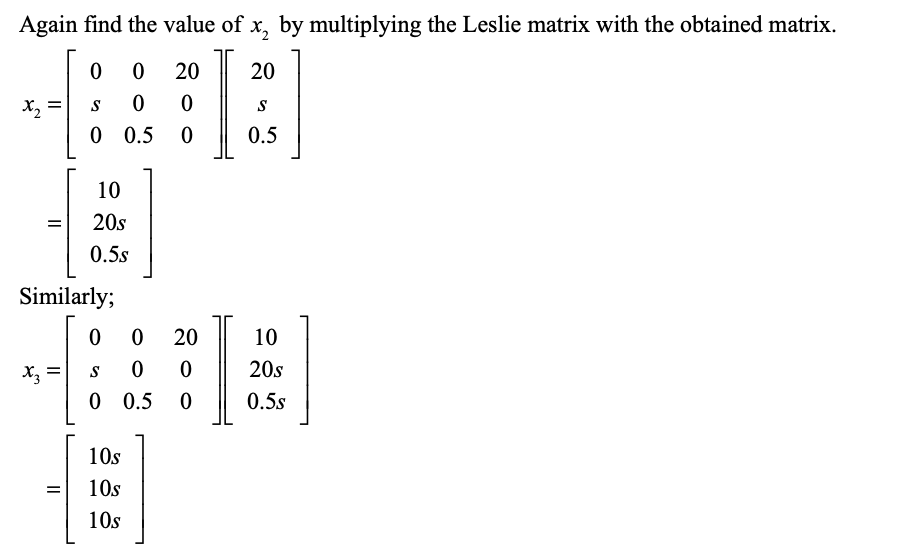
Suppose the Leslie matrix for the VW beetle is L .Investigate the effect variying the survival probabiltys of the young beetles.
Step by step
Solved in 3 steps with 3 images
- 13) Identify the terms in the master equation that we used, which is given beiow, in our linear least-squares fitting procedureSuppose they conducted another set of experiment with increased sample size and saw that the three caffeine concentrations resulted to a different mean adenine concentration. Table below showed summary of Tukey’s HSD. Summarize the result of Tukey’s HSD in Table 2 and provide synthesis, given 5% level of significance. Table 1. Matrix of HSD’s test result for the experiment Treatments Mean difference p - value 0mM – 5mM 2.6283 <0.001 *** 0mM – 10mM 3.9383 0.0112 * 5mM – 10mM 1.3100 0.2458 Table 2. Summary of HSD’s result Treatment Mean SD Summary (in letter or in dot form) 0mM 6.0233 1.1508026 5mM 3.3950 1.8064855 10mM 2.0850 0.9490153 Synthesis: ________________________________________________________ ________________________________________________________ ________________________________________________________ ________________________________________________________The MAKSI FEB UI program is considering buying a copier machine among 5 (five) types, namely the FC1, FC2, FC3, FC4 and FC5 types, where each type has different efficiency in terms of the speed of the number of pages (sheets) copied in one minute. Six staff members conducted an experiment to run each type of copier. The following data shows the number of copied pages (sheets) that can be produced in one minute according to the type of copier, 1 trial, and according to the staff assigned to run each type of copier: FC1 FC2 FC3 FC4 FC5 Staff 1 60 50 63 60 64 Staff 2 56 55 65 58 60 Staff 3 54 56 65 56 58 Staff 4 56 57 67 65 60 Staff 5 54 56 65 60 60 Staff 6 55 52 58 60 55 Some of the results of the calculation of the sum of squares (sum-square) and the average squared (mean square) required for the ANOVA test are provided in the following table: Source of Variation SS Df MS Fstat FTable CopierMachine 333.33 ……… ……… ……… ……… Staff ……….. ……… ……… ……… ……… Error 129.47 ……… ……… Total 532.67 …………
- You are asked to evaluate 'Introduction to the Matrix' from the statistical data of thefollowing seven (7) 'Introduction to the Matrix' course grade distributions: Class A Class B Class C Class D Class E Class F Class G Mean 71.8 75.2 73.8 82.2 79.6 78.0 73.7 Median 79.3 78.5 80.1 83.4 81.4 77.6 75.9 Mode 80.1 78.5 80.5 83.0 81.0 78.0 70.0 Std Dev 18.6 15.9 15.5 5.1 11.4 7.0 15.1 Students 24 23 14 17 29 18 13 Which 3 'Introduction to the Matrix' classes would you most likely suspectto be possible outliers from these 7 classes?True or False: In a model with an interaction variable, we can drop the interaction term if its pvalue>.05Determine the heteroscedasticity in a scatter plot?
- Red Wine and Weight LossResveratrol, a compound in grapes and red wine, has been shown to promote weight loss in rodents and now in a primate.1 Lemurs fed a resveratrol supplement for four weeks had decreased food intake, increased metabolic rate, and a reduction in seasonal body-mass gain compared to a control group. Suppose a hypothetical study is done for a different primate species, with one group given a resveratrol supplement and the other group given a placebo. We wish to see if there is evidence that resveratrol increases the mean metabolism rate for this species. (This exercise presents hypothetical data. We will see the results from the actual study later in this chapter.) (a) State the null and alternative hypotheses.Let group 1 be the species taking a resveratrol supplement and let group 2 be the species taking a placebo.There are 6 linearly independent vectors in R5. O True FalseGiven the values: n= 20, xbar= 5, ybar= 15, SSy = 24, SSxx = 10, and SSyy = 52 what is the least squares prediction equation for the simple linear model? O y_hat = 3 + 2.4x O y_hat = 52 + 25x O y = Bo + B1x + 8 O y hat = 12.4 + 36x
- Consider the following population model for household consumption: cons = a + b1 * inc+ b2 * educ+ b3 * hhsize + u where cons is consumption, inc is income, educ is the education level of household head, hhsize is the size of a household. Suppose a researcher estimates the model and gets the predicted value, cons_hat, and then runs a regression of cons_hat on educ, inc, and hhsize. Which of the following choice is correct and please explain why. A) be certain that R^2 = 1 B) be certain that R^2 = 0 C) be certain that R^2 is less than 1 but greater than 0. D) not be certainCopepods are tiny crustaceans that are an essential link in the estuarine food web. Marine scientists designed an experiment to determine whether dietary lipid Diatoms Bacteria Macroalgae 429 292 289 (fat) content is important in the population growth of a copepod. Independent random samples of copepods were placed in containers containing lipid-rich diatoms, bacteria, or leafy macroalgae. There were 12 containers total with four replicates per diet. Five gravid (egg-bearing) females were placed in each container. After 14 days, the number of copepods in each container were as given to the right. At the 5% significance level, do the data provide sufficient evidence to conclude that a difference exists in mean number of copepods among the three different diets? 465 303 311 447 295 495 329 Click here to view page 1 of the F-distribution. Click here to view page 2 of the F-distribution. Click here to view page 3 of the F-distribution. Click here to view page 4 of the F-distribution.…5