What does the Cp statistic tell us about the two models with 3 predictor variables in them? a. Additional variables would need to be added to those models to improve prediction and reduce bias b. The Cp statistic does not tell us anything about whether the models should include a different number of variables c. These models would not need to have variables added or removed based on Cp, but other metrics might indicate that another model is better d. Variables would need to be removed from those models to improve prediction and reduce bias


What does the Cp statistic tell us about the two models with 3 predictor variables in them?
| a. |
Additional variables would need to be added to those models to improve prediction and reduce bias |
|
| b. |
The Cp statistic does not tell us anything about whether the models should include a different number of variables |
|
| c. |
These models would not need to have variables added or removed based on Cp, but other metrics might indicate that another model is better |
|
| d. |
Variables would need to be removed from those models to improve prediction and reduce bias |

Given
The total number of predictor variables
The Cp statistic for different models are shown below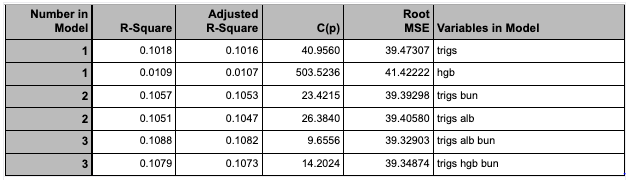
An underspecified model will have biased regression coefficients and biased predictions of dependent variable. Cp statistic estimates the size of the bias in the predicted values of dependent variable. Thus higher the value of Cp more likely to be biased responses.
Cp statistic can be used to identify the best regression models.
If all models yield large Cp values except the model with all variables included indicates that some important variable is not included in the study.
If the Cp statistic is minimum or closely equal to number of predictor variables +1 then we can say that the there is no bias and the variation is also minimum.

Trending now
This is a popular solution!

Step by step
Solved in 2 steps with 1 images


