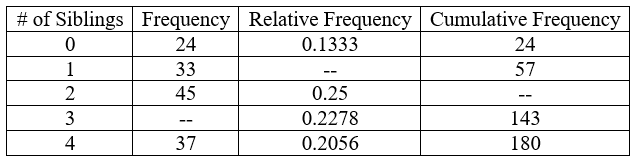
180 people are asked how many siblings they have? # of Siblings Frequency Relative Frequency Cumulative Frequency 24 0.1333 24 1 33 57 2 45 0.25 3 0.2278 143 4 37 0.2056 180 a. Complete the table (Use 4 decimal places when applicable) b. What percent of the people have exactly zero siblings?
180 people are asked how many siblings they have? # of Siblings Frequency Relative Frequency Cumulative Frequency 24 0.1333 24 1 33 57 2 45 0.25 3 0.2278 143 4 37 0.2056 180 a. Complete the table (Use 4 decimal places when applicable) b. What percent of the people have exactly zero siblings?

MATLAB: An Introduction with Applications
6th Edition
ISBN:9781119256830
Author:Amos Gilat
Publisher:Amos Gilat
Chapter1: Starting With Matlab
Section: Chapter Questions
Problem 1P

Related questions
Question
I having a hard time understanding Frequency, Frequency Tables, and Levels of Measurement. Can anyone explain to me how to the measurements and things like that? I have a few problems that I can show.

Transcribed Image Text:180 people are asked how many siblings they have?
# of Siblings Frequency Relative Frequency Cumulative Frequency
24
0.1333
24
1
33
57
2
45
0.25
0.2278
143
37
0.2056
180
a. Complete the table (Use 4 decimal places when applicable)
b. What percent of the people have exactly zero siblings?
3.
![Here is a data set:
355
438
458
461
462
484
496
504
518
530
543
552
553
557
566
571
588
599
619
629
644
660
664
667
677
714
780
833
Construct a frequency distribution table for this data set.
• Number of classes: 10
• Use a "nice" class width, such as a multiple of 5 or 10.
• Label classes using interval notation.
• For example, if the class is 70-79, label it as [70,79].
• The lower class limit should be a multiple of the class width.
• For example, if the class width is 10, the lower class limit should be a number like 30 or 40
(depending on the data).
Data range
|Frequency](/v2/_next/image?url=https%3A%2F%2Fcontent.bartleby.com%2Fqna-images%2Fquestion%2Fc84b4411-073a-4ec2-bedc-41e017d0209c%2Ffc96925a-a5f2-4ba3-8c0d-713cd49e4fba%2Fqs6zqq_processed.png&w=3840&q=75)
Transcribed Image Text:Here is a data set:
355
438
458
461
462
484
496
504
518
530
543
552
553
557
566
571
588
599
619
629
644
660
664
667
677
714
780
833
Construct a frequency distribution table for this data set.
• Number of classes: 10
• Use a "nice" class width, such as a multiple of 5 or 10.
• Label classes using interval notation.
• For example, if the class is 70-79, label it as [70,79].
• The lower class limit should be a multiple of the class width.
• For example, if the class width is 10, the lower class limit should be a number like 30 or 40
(depending on the data).
Data range
|Frequency
Expert Solution
Step 1
Hi, thanks for posting the question. Since there is more than one question posted. We will answer for the first question. If you want any specific question to be answered and then post that question or mention that question.
The given table is as follows:

Trending now
This is a popular solution!

Step by step
Solved in 2 steps with 5 images

Knowledge Booster


Learn more about
Need a deep-dive on the concept behind this application? Look no further. Learn more about this topic, statistics and related others by exploring similar questions and additional content below.Recommended textbooks for you
MATLAB: An Introduction with Applications
Statistics
ISBN:
9781119256830
Author:
Amos Gilat
Publisher:
John Wiley & Sons Inc

Probability and Statistics for Engineering and th…
Statistics
ISBN:
9781305251809
Author:
Jay L. Devore
Publisher:
Cengage Learning

Statistics for The Behavioral Sciences (MindTap C…
Statistics
ISBN:
9781305504912
Author:
Frederick J Gravetter, Larry B. Wallnau
Publisher:
Cengage Learning
MATLAB: An Introduction with Applications
Statistics
ISBN:
9781119256830
Author:
Amos Gilat
Publisher:
John Wiley & Sons Inc
Probability and Statistics for Engineering and th…
Statistics
ISBN:
9781305251809
Author:
Jay L. Devore
Publisher:
Cengage Learning
Statistics for The Behavioral Sciences (MindTap C…
Statistics
ISBN:
9781305504912
Author:
Frederick J Gravetter, Larry B. Wallnau
Publisher:
Cengage Learning

Elementary Statistics: Picturing the World (7th E…
Statistics
ISBN:
9780134683416
Author:
Ron Larson, Betsy Farber
Publisher:
PEARSON

The Basic Practice of Statistics
Statistics
ISBN:
9781319042578
Author:
David S. Moore, William I. Notz, Michael A. Fligner
Publisher:
W. H. Freeman

Introduction to the Practice of Statistics
Statistics
ISBN:
9781319013387
Author:
David S. Moore, George P. McCabe, Bruce A. Craig
Publisher:
W. H. Freeman