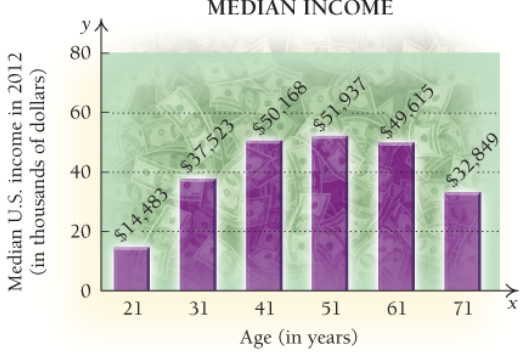
For the
Linear,
Quadratic,
Quadratic
Polynomial, neither quadratic nor linear
Exponential,

(Source: U.S. Census Bureau.)
Want to see the full answer?
Check out a sample textbook solution
Chapter R Solutions
Calculus and Its Applications (11th Edition)
Additional Math Textbook Solutions
Calculus: Early Transcendentals (2nd Edition)
Precalculus Enhanced with Graphing Utilities (7th Edition)
Precalculus: Concepts Through Functions, A Unit Circle Approach to Trigonometry (4th Edition)
Thomas' Calculus: Early Transcendentals (14th Edition)
Calculus: Early Transcendentals (3rd Edition)
- Regression and Predictions. Exercises 13–28 use the same data sets as Exercises 13–28 in Section 10-1. In each case, find the regression equation, letting the first variable be the predictor (x) variable. Find the indicated predicted value by following the prediction procedure summarized in Figure 10-5 on page 493. Manatees Use the listed boat/manatee data. In a year not included in the data below, there were 970,000 registered pleasure boats in Florida. Find the best predicted number of manatee fatalities resulting from encounters with boats. Is the result reasonably close to 79, which was the actual number of manatee fatalities?arrow_forwardSam Jones has 2 years of historical sales data for his company. He is applyingfor a business loan and must supply his projections of sales by month for thenext 2 years to the bank. a. Using the data from Table 6–12, provide a regression forecast for timeperiods 25 through 48.b. Does Sam’s sales data show a seasonal pattern?arrow_forwardThe U.S. Department of Health and Human Services provides a summary of the number and rate of abortions for the period 1990–2006. Based on these data, the United States abortion rate (number of abortions per 1000 women) can be estimated by the linear function R(x) = −0.58x + 23.9 where x is the year since 1990 and R(x) is the abortion rate. (a) Based on this function, is the rate increasing or decreasing? The slope is , so the rate is . (b) Find the estimated abortion rate for 2007 and for 2017. 2007 abortions per 1000 women 2017 abortions per 1000 women (c) Estimate the year when the abortion rate will be 10. (Round your answer to the nearest year.)arrow_forward
- Find the natural spline for the data: x0 = 0, x1 = 1, x2 = 2, and f(x0) =1.2, f(x1) = 1.3, f(x2) = 1.0.arrow_forwardEach of Exercises 25–36 gives a formula for a function y = f(x). In each case, find f-x) and identify the domain and range of f-. As a check, show that f(fx)) = f-"f(x)) = x. 25. f(x) = x 26. f(x) = x, x20 %3D %3D 27. f(x) = x + 1 28. f(x) = (1/2)x – 7/2 30. f(x) = 1/r, x * 0 %3D 29. f(x) = 1/x, x>0 x + 3 31. f(x) 32. f(x) = VE - 3 34. f(x) = (2x + 1)/5 2 33. f(x) = x - 2r, xs1 (Hint: Complete the square.) * + b x - 2' 35. f(x) = b>-2 and constant 36. f(x) = x? 2bx, b> 0 and constant, xsbarrow_forwardFor a certain product it was found that annual sales volume could be well described by a third-order autoregressive model. The estimated model is shown below. x = 197 +1.80x₁-1-0.29x₁-2 +0.03x₁-3 + + &t For 1993, 1994, and 1995, sales were 880, 913, and 951, respectively. Calculate sales forecasts for the years 1996 through 1998. X1996 = (Round to one decimal place as needed.)arrow_forward
- In Exercises 87–88, use the graph of f(x) = |4 – x| to solve each equation or inequality. y flx) = |4 – x| y = 53- y = 1 $ 9 10 87. 14 - x| = 1 88. 14 - x| < 5arrow_forwardUsing the data in Table 6–11, answer the following:a. What is the slope?b. What is the intercept?c. Write the regression equation.d. Calculate a regression forecast for month 25.arrow_forwardAnswer the exercise of the image. (In the other image are the final answers, this to verify the final answer).arrow_forward
- 2. Which model-linear, quadratic, or exponential-seems most appropriate for this scatter plot? Xarrow_forwardCity Fuel Consumption: Finding the Best Multiple Regression Equation. In Exercises 9–12, refer to the accompanying table, which was obtained using the data from 21 cars listed in Data Set 20 “Car Measurements” in Appendix B. The response (y) variable is CITY (fuel consumption in mi/gal). The predictor (x) variables are WT (weight in pounds), DISP (engine displacement in liters), and HWY (highway fuel consumption in mi /gal). Which regression equation is best for predicting city fuel consumption? Why?arrow_forwardCity Fuel Consumption: Finding the Best Multiple Regression Equation. In Exercises 9–12, refer to the accompanying table, which was obtained using the data from 21 cars listed in Data Set 20 “Car Measurements” in Appendix B. The response (y) variable is CITY (fuel consumption in mi/gal). The predictor (x) variables are WT (weight in pounds), DISP (engine displacement in liters), and HWY (highway fuel consumption in mi /gal). A Honda Civic weighs 2740 lb, it has an engine displacement of 1.8 L, and its highway fuel consumption is 36 mi/gal. What is the best predicted value of the city fuel consumption? Is that predicted value likely to be a good estimate? Is that predicted value likely to be very accurate?arrow_forward
- Algebra & Trigonometry with Analytic GeometryAlgebraISBN:9781133382119Author:SwokowskiPublisher:Cengage
