APPLICATIONS
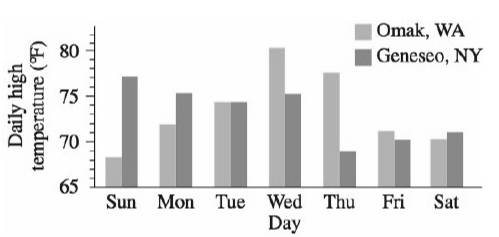
Temperature Variation The bar graph shows the daily high temperatures for Omak, Washington, and Geneseo, New York, during a certain week in June. Let

Want to see the full answer?
Check out a sample textbook solution
Chapter P Solutions
Algebra and Trigonometry (MindTap Course List)
- Solve the problems on the imagearrow_forwardAsked this question and got a wrong answer previously: Third, show that v3 = (−√3, −3, 3)⊤ is an eigenvector of M3 . Also here find the correspondingeigenvalue λ3 . Just from looking at M3 and its components, can you say something about the remaining twoeigenvalues? If so, what would you say?arrow_forwardDetermine whether the inverse of f(x)=x^4+2 is a function. Then, find the inverse.arrow_forward
- The 173 acellus.com StudentFunctions inter ooks 24-25/08 R Mastery Connect ac ?ClassiD-952638111# Introduction - Surface Area of Composite Figures 3 cm 3 cm 8 cm 8 cm Find the surface area of the composite figure. 2 SA = [?] cm² 7 cm REMEMBER! Exclude areas where complex shapes touch. 7 cm 12 cm 10 cm might ©2003-2025 International Academy of Science. All Rights Reserved. Enterarrow_forwardYou are given a plane Π in R3 defined by two vectors, p1 and p2, and a subspace W in R3 spanned by twovectors, w1 and w2. Your task is to project the plane Π onto the subspace W.First, answer the question of what the projection matrix is that projects onto the subspace W and how toapply it to find the desired projection. Second, approach the task in a different way by using the Gram-Schmidtmethod to find an orthonormal basis for subspace W, before then using the resulting basis vectors for theprojection. Last, compare the results obtained from both methodsarrow_forwardPlane II is spanned by the vectors: - (2) · P² - (4) P1=2 P21 3 Subspace W is spanned by the vectors: 2 W1 - (9) · 1 W2 1 = (³)arrow_forward
- show that v3 = (−√3, −3, 3)⊤ is an eigenvector of M3 . Also here find the correspondingeigenvalue λ3 . Just from looking at M3 and its components, can you say something about the remaining twoeigenvalues? If so, what would you say? find v42 so that v4 = ( 2/5, v42, 1)⊤ is an eigenvector of M4 with corresp. eigenvalue λ4 = 45arrow_forwardChapter 4 Quiz 2 As always, show your work. 1) FindΘgivencscΘ=1.045. 2) Find Θ given sec Θ = 4.213. 3) Find Θ given cot Θ = 0.579. Solve the following three right triangles. B 21.0 34.6° ca 52.5 4)c 26° 5) A b 6) B 84.0 a 42° barrow_forwardQ1: A: Let M and N be two subspace of finite dimension linear space X, show that if M = N then dim M = dim N but the converse need not to be true. B: Let A and B two balanced subsets of a linear space X, show that whether An B and AUB are balanced sets or nor. Q2: Answer only two A:Let M be a subset of a linear space X, show that M is a hyperplane of X iff there exists ƒ€ X'/{0} and a € F such that M = (x = x/f&x) = x}. fe B:Show that every two norms on finite dimension linear space are equivalent C: Let f be a linear function from a normed space X in to a normed space Y, show that continuous at x, E X iff for any sequence (x) in X converge to Xo then the sequence (f(x)) converge to (f(x)) in Y. Q3: A:Let M be a closed subspace of a normed space X, constract a linear space X/M as normed space B: Let A be a finite dimension subspace of a Banach space X, show that A is closed. C: Show that every finite dimension normed space is Banach space.arrow_forward

 College AlgebraAlgebraISBN:9781305115545Author:James Stewart, Lothar Redlin, Saleem WatsonPublisher:Cengage Learning
 Glencoe Algebra 1, Student Edition, 9780079039897...AlgebraISBN:9780079039897Author:CarterPublisher:McGraw Hill
 College Algebra (MindTap Course List)AlgebraISBN:9781305652231Author:R. David Gustafson, Jeff HughesPublisher:Cengage Learning
 Holt Mcdougal Larson Pre-algebra: Student Edition...AlgebraISBN:9780547587776Author:HOLT MCDOUGALPublisher:HOLT MCDOUGAL
 Algebra and Trigonometry (MindTap Course List)AlgebraISBN:9781305071742Author:James Stewart, Lothar Redlin, Saleem WatsonPublisher:Cengage Learning


