1)
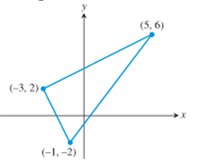
The length of the sides of the triangle in given figure.
The length of the sides of the triangle in given figure are
Given information:
Given figure is:

Formula used:
The distance between two points,
Calculation:
To calculate the length of the sides of the triangle in given figure use the formula for the distance between two points
The length of the side with end points
Similarly, the length of the side with end points
And, the length of the side with end points
Thus, the length of the sides of the triangle in given figure are
2)
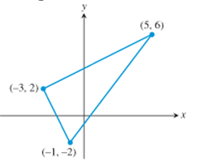
To proof the triangle is right triangle.
Yes, the triangle is right triangle.
Given information:
Given figure is:

And the length of the sides of the triangle in given figure are
Formula used:
A triangle is right triangle if sum square of length of two sides of the triangle is equals to the square of third side, i.e. if length of the length of sides of the triangles are a, b, and c then it is right triangle if
Calculation:
To proof that the triangle is right triangle use the property that a triangle is right triangle if sum square of length of two sides of the triangle is equals to the square of third side.
Here, the length of the sides of the triangle in given figure are
And,
And,
Thus,
Thus, it satisfies the property sum square of length of two sides of the triangle is equals to the square of third side.
Thus, given triangle is right triangle.
Chapter P Solutions
PRECALCULUS:...COMMON CORE ED.-W/ACCESS
 Calculus: Early TranscendentalsCalculusISBN:9781285741550Author:James StewartPublisher:Cengage Learning
 Thomas' Calculus (14th Edition)CalculusISBN:9780134438986Author:Joel R. Hass, Christopher E. Heil, Maurice D. WeirPublisher:PEARSON
 Calculus: Early Transcendentals (3rd Edition)CalculusISBN:9780134763644Author:William L. Briggs, Lyle Cochran, Bernard Gillett, Eric SchulzPublisher:PEARSON
 Calculus: Early TranscendentalsCalculusISBN:9781319050740Author:Jon Rogawski, Colin Adams, Robert FranzosaPublisher:W. H. Freeman
 Calculus: Early Transcendental FunctionsCalculusISBN:9781337552516Author:Ron Larson, Bruce H. EdwardsPublisher:Cengage Learning


