Horngren's Financial & Managerial Accounting, The Managerial Chapters (6th Edition)
6th Edition
ISBN: 9780134486857
Author: Tracie L. Miller-Nobles, Brenda L. Mattison, Ella Mae Matsumura
Publisher: PEARSON
expand_more
expand_more
format_list_bulleted
Textbook Question
Chapter D, Problem 27AP
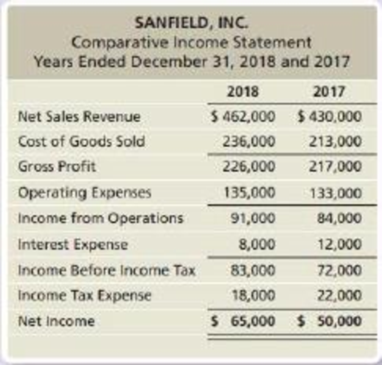
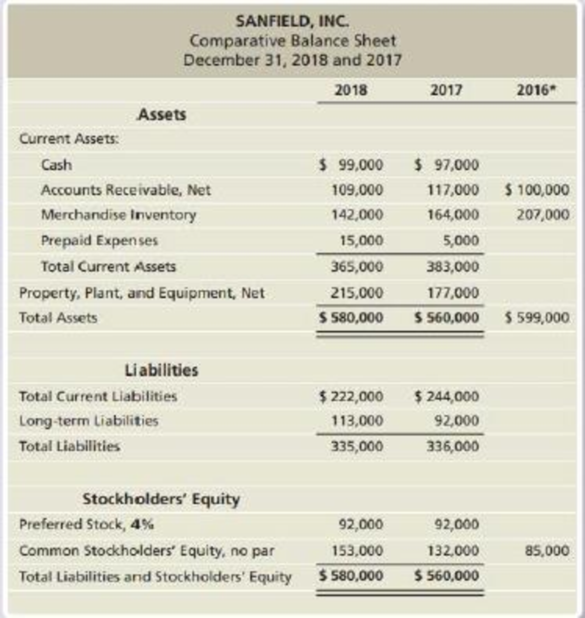
Comparative financial statement data of Sanfield, Inc. follow:


* Selected 2016 amounts
- 1. Market price of Sanfield’s common stock: $51.48 at December 31, 2018, and $37.08 at December 31, 2017.
- 2. Common shares outstanding: 16,000 on December 31, 2018 and 15,000 on December 31, 2017 and 2016.
- 3. All sales are on credit
Requirements
- 1. Compute the following ratios for 2018 and 2017:
- a.
Current ratio - b. Cash ratio
- c. Times-interest-earned ratio
- d. Inventory turnover
- e. Gross profit percentage
- f. Debt to equity ratio
- g.
Rate of return on common stockholders’ equity - h. Earnings per share of common stock
- i. Price/earnings ratio
- a.
- 2. Decide (a) whether Sanfield’s ability to pay debts and to sell inventory improved or deteriorated during 2018 and (b) whether the investment attractiveness of its common stock appears to have increased or decreased.
Expert Solution & Answer
Want to see the full answer?
Check out a sample textbook solution
Students have asked these similar questions
Needam Company has analyzed its production process and identified two primary activities. These activities, their allocation bases, and their estimated costs are listed below.
BEE (Click on the icon to view the estimated costs data.)
The company manufactures two products: Regular and Super. The products use the following resources in March:
BEE (Click on the icon to view the actual data for March.)
Read the requirements.
Requirement 5. Compute the predetermined overhead allocation rates using activity-based costing.
Begin by selecting the formula to calculate the predetermined overhead (OH) allocation rate. Then enter the amounts to compute the all
Actual overhead costs
Actual qty of the allocation base used
Estimated overhead costs
Estimated qty of the allocation base
Predetermined OH
allocation rate
Data table
Data table
Regular
Super
Number of purchase orders 10 purchase orders
Number of parts
600 parts
13 purchase orders
800 parts
Activity
Purchasing
Materials handling
- X…
Makenna is a waiter at Albicious Foods in South Carolina. Makenna is single with one other dependent and receives the standard tipped hourly wage. During the week ending October 25, 2024, Makenna worked 44 hours and received $210 in tips. Calculate Makenna's gross pay, assuming tips are included in the overtime rate determination. Use Table 3-2.
Required:
1. Complete the payroll register for Makenna.
2a. Does Albicious Foods need to contribute to Makenna’s wages to meet FLSA requirements?
2b. If so, how much should be contributed?
10.
Record the journal entries for Holley Company for August.
11.
Post appropriate entries to the Conversion Costs T-account to determine the amount of underallocated or overallocated overhead. Record the adjusting entry.
10. Record the journal entries for Holley Company for August. (Record debits first, then credits. Exclude explanations from journal entries)
Journalize the purchase of raw materials.
Date
5
a.
Accounts
Debit
Credit
Accounts Payable
Accounts Receivable
Conversion Costs
Cost of Goods Sold
Finished Goods Inventory
Raw and In-Process Inventory
Sales Revenue
Wages Payable, Accumulated Depreciation, etc.
More info
a.
Purchased raw materials on account, $30,000.
b
Incurred labor and overhead costs, $65,000.
C
d.
Completed 900 units with standard costs of $75 for direct materials and $180 for conversion costs.
Sold on account 600 units for $400 each.
Print
Done
- X
Chapter D Solutions
Horngren's Financial & Managerial Accounting, The Managerial Chapters (6th Edition)
Ch. D - Prob. 1TICh. D - Prob. 2TICh. D - Prob. 3TICh. D - Prob. 4TICh. D - Prob. 5TICh. D - Prob. 6TICh. D - Prob. 7TICh. D - Prob. 8TICh. D - Prob. 9TICh. D - Prob. 10TI
Ch. D - Prob. 1QCCh. D - Prob. 2QCCh. D - Vertical analysis of Libertys balance sheet for...Ch. D - Prob. 4QCCh. D - Libertys inventory turnover during 2019 was...Ch. D - Prob. 6QCCh. D - Prob. 7QCCh. D - Prob. 8QCCh. D - Prob. 9QCCh. D - Prob. 10QCCh. D - Prob. 1RQCh. D - Prob. 2RQCh. D - Prob. 3RQCh. D - Prob. 4RQCh. D - Prob. 5RQCh. D - Prob. 6RQCh. D - Prob. 7RQCh. D - Prob. 8RQCh. D - Prob. 9RQCh. D - Prob. 10RQCh. D - Prob. 11RQCh. D - Prob. 12RQCh. D - Prob. 13RQCh. D - Prob. 1SECh. D - Verifine Corp. reported the following on its...Ch. D - Prob. 3SECh. D - Prob. 4SECh. D - Prob. 5SECh. D - Prob. 6SECh. D - Prob. 7SECh. D - Accels Companies, a home improvement store chain,...Ch. D - Prob. 9SECh. D - Prob. 10SECh. D - Prob. 11SECh. D - Prob. 12SECh. D - Prob. 13ECh. D - Prob. 14ECh. D - Prob. 15ECh. D - Refer to the data presented for Mulberry Designs,...Ch. D - Prob. 17ECh. D - Prob. 18ECh. D - Prob. 19ECh. D - Micatin, Inc.s comparative income statement...Ch. D - Prob. 21ECh. D - Prob. 22ECh. D - Prob. 23APCh. D - Prob. 24APCh. D - Prob. 25APCh. D - Prob. 26APCh. D - Comparative financial statement data of Sanfield,...Ch. D - Prob. 28APCh. D - Prob. 29APCh. D - Prob. 30BPCh. D - Prob. 31BPCh. D - Prob. 32BPCh. D - Prob. 33BPCh. D - Prob. 34BPCh. D - Prob. 35BPCh. D - In its annual report, XYZ Athletic Supply, Inc....Ch. D - Prob. 38PCh. D - Lance Berkman is the controller of Saturn, a dance...Ch. D - Prob. 1EICh. D - Prob. 1FSC
Knowledge Booster
Learn more about
Need a deep-dive on the concept behind this application? Look no further. Learn more about this topic, accounting and related others by exploring similar questions and additional content below.Similar questions
- The Coyle Shirt Company manufactures shirts in two departments: Cutting and Sewing. The company allocates manufacturing overhead using a single plantwide rate with direct labor hours as the allocation base. Estimated overhead costs for the year are $630,000, and estimated direct labor hours are 210,000. In June, the company incurred 18,200 direct labor hours. 1. 2. Compute the predetermined overhead allocation rate. Determine the amount of overhead allocated in June. The Coyle Shirt Company has refined its allocation system by separating manufacturing overhead costs into two cost pools-one for each department. (Click the icon to view the estimated costs and allocation data for each department.) 3. Compute the predetermined overhead allocation rates for each department. 4. Determine the total amount of overhead allocated in June. 1. Compute the predetermined overhead allocation rate. Begin by selecting the formula to calculate the predetermined overhead (OH) allocation rate. Then enter…arrow_forwardDecentralized businesses can have three responsibility centers that must be evaluated differently because of their functions. • Describe the three responsibility centers and give an example of each from your work. • Give an explanation about how each is evaluated. • Tell us why you would prefer to work in a centralized or decentralized organization. • Discuss which type of responsibility center you would prefer to manage and why.arrow_forwardDo fast this question answer general Accountingarrow_forward
- 12. Identify the following costs as preveron, appraisal, internal failure, or external failure: a. Inspection of final products b. Sales returns of defective products c. Employee training d. Reworking defective products e. Working with suppliers to ensure delivery of high-quality raw materials f. Costs of warranty repairs g. Product testing Type of cost Prevention Appraisal Internal failure External failurearrow_forwardYou invest $1,500 today to purchase a new machine that is expected to generate the following revenues over the next 4 years: Year 0 1 2 3 4 Cash flow -1500 300 475 680 490 Find the internal rate of return (IRR) from this investment. What would be the net present value (NPV) if the interest rate is 10%? An investment project provides cash inflows of $560 per year for 10 years. What is the project’s payback period if the initial cost is $2,500? What if the initial cost is $3,250? An investment project has annual cash inflows of $2,000, $2,500, $3,000, and $4,000, and a discount rate of 11%. What is the discounted payback period for these cash flows if the initial cost is $4,800? What if the initial cost is $5,600?arrow_forwardHow does the treatment of costs differ in ABC systems as opposed to traditional cost systems?arrow_forward
- Hii ticher please given correct answer general accountingarrow_forwardFinancial accountingarrow_forwardOn October 1, 2019, Ball Company issued 10% bonds dated October 1, 2019, with a face amount of $380,000. The bonds mature in 10 years. Interest is paid semiannually on March 31 and September 30. The proceeds from the bond issuance were $384,776.05 to yield 9.80%. Ball Company has a December 31 fiscal year-end and does not use reversing entries. Required: 1. Prepare journal entries to record the issuance of the bonds and the interest payments for 2019 and 2020 using the effective interest method. 2. Prepare journal entries to record the issuance of the bonds and the interest payments for 2019 and 2020 using the straight-line method.arrow_forward
arrow_back_ios
SEE MORE QUESTIONS
arrow_forward_ios
Recommended textbooks for you
 Cornerstones of Financial AccountingAccountingISBN:9781337690881Author:Jay Rich, Jeff JonesPublisher:Cengage Learning
 Financial Accounting: The Impact on Decision Make...AccountingISBN:9781305654174Author:Gary A. Porter, Curtis L. NortonPublisher:Cengage Learning
 Financial AccountingAccountingISBN:9781305088436Author:Carl Warren, Jim Reeve, Jonathan DuchacPublisher:Cengage Learning
 Managerial AccountingAccountingISBN:9781337912020Author:Carl Warren, Ph.d. Cma William B. TaylerPublisher:South-Western College Pub

Cornerstones of Financial Accounting
Accounting
ISBN:9781337690881
Author:Jay Rich, Jeff Jones
Publisher:Cengage Learning

Financial Accounting: The Impact on Decision Make...
Accounting
ISBN:9781305654174
Author:Gary A. Porter, Curtis L. Norton
Publisher:Cengage Learning

Financial Accounting
Accounting
ISBN:9781305088436
Author:Carl Warren, Jim Reeve, Jonathan Duchac
Publisher:Cengage Learning


Managerial Accounting
Accounting
ISBN:9781337912020
Author:Carl Warren, Ph.d. Cma William B. Tayler
Publisher:South-Western College Pub
Financial ratio analysis; Author: The Finance Storyteller;https://www.youtube.com/watch?v=MTq7HuvoGck;License: Standard Youtube License