
Concept explainers
Videos
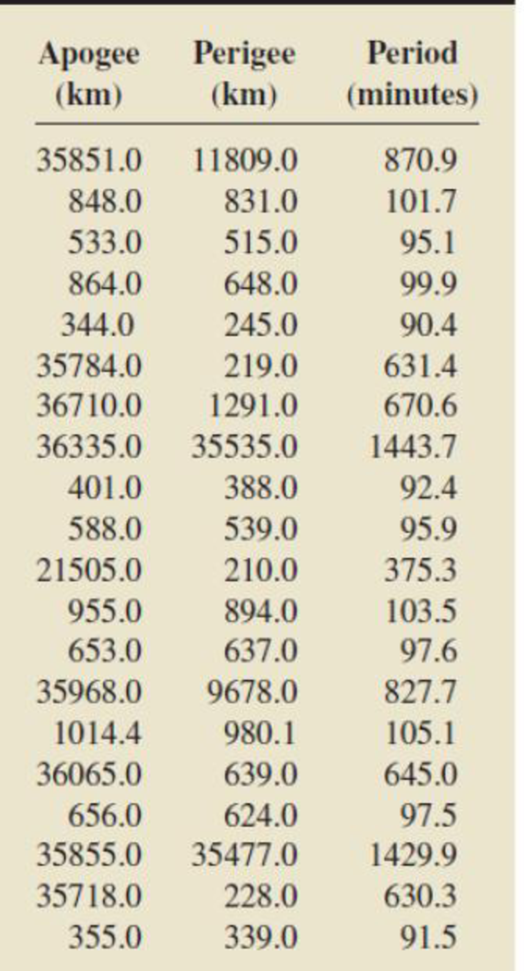
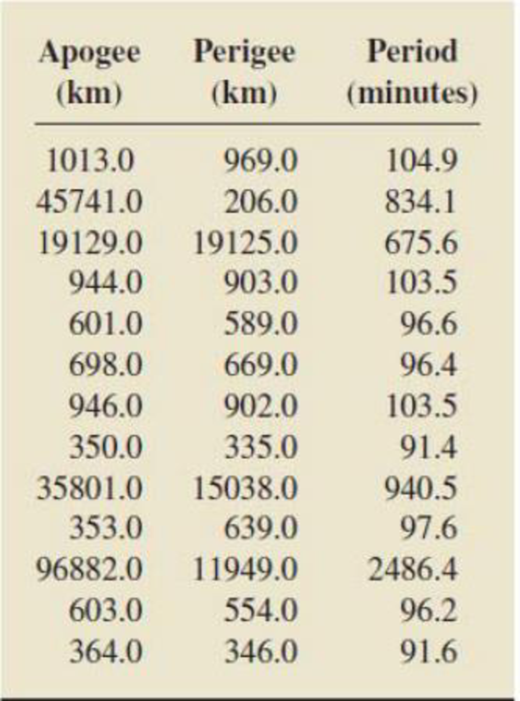
Satellite Orbits. Each issue of the magazine Ad Astra presents a list of space satellites that are launched into earth orbit during a two-month period. Also provided are the period of the satellite (time required to make one orbit of the earth), the apogee of the satellite (maximum distance from the earth), and the perigee of the satellite (minimum distance from the earth). The table below displays data on satellites placed in earth orbit from November 1998 through April, 1999 (Ad Astra, 11, Numbers 2, 3, 4). Multiple satellites placed in the same orbit during a single launch are listed as one observation only. We want to develop a second-order polynomial regression equation relating satellite period to apogee and perigee. (Readers interested in astronomy should investigate why this is an appropriate model.) Use the technology of your choice to do the following.
- a. Obtain a
scatterplot matrix for the observed values of period, apogee, and perigee. What do these plots indicate about the relationship between period and apogee? between period and perigee? - b. Obtain a three-dimensional scatterplot of period versus apogee and perigee. What does this plot indicate about the relationship between period and the two predictor variables apogee and perigee?
- c. Obtain the
correlation coefficients between period and the first- and second-order terms in the centered predictor variables apogeec and perigeec. Which terms are most highly correlated with period? What are the correlation coefficients between the first- and second-order terms? Will thesecorrelations adversely affect the ability to assess the effect of a term in the presence of the other terms? Explain your answer. - d. Perform a second-order polynomial
regression analysis for period using the centered predictor variables apogeec and perigeec. Based on the t-tests for the individual utility of each term in the model, which terms would you retain in the regression equation? Is it appropriate to use the t-tests here?
- e. Obtain plots of residuals versus fitted values, residuals versus apogeeC, and residuals versus perigeec, and also a normal probability plot of the residuals. Assess the appropriateness of the second-order polynomial regression equation, the assumption of constant conditional standard deviations, and the assumption of normality of the conditional distributions. Check for outliers and influential observations.
- f. Does your analysis in part (e) reveal any violations of the assumptions for regression inferences? Explain.
- g. Would it be appropriate to use the second-order polynomial regression equation obtained here to predict the period of the moon? Explain your answer.

Learn your wayIncludes step-by-step video

Chapter B Solutions
Introductory Statistics (10th Edition)
Additional Math Textbook Solutions
A Problem Solving Approach To Mathematics For Elementary School Teachers (13th Edition)
University Calculus: Early Transcendentals (4th Edition)
Thinking Mathematically (6th Edition)
Elementary Statistics: Picturing the World (7th Edition)
Elementary Statistics
College Algebra (7th Edition)


- What do you guess are the standard deviations of the two distributions in the previous example problem?arrow_forwardPlease answer the questionsarrow_forward30. An individual who has automobile insurance from a certain company is randomly selected. Let Y be the num- ber of moving violations for which the individual was cited during the last 3 years. The pmf of Y isy | 1 2 4 8 16p(y) | .05 .10 .35 .40 .10 a.Compute E(Y).b. Suppose an individual with Y violations incurs a surcharge of $100Y^2. Calculate the expected amount of the surcharge.arrow_forward
- 24. An insurance company offers its policyholders a num- ber of different premium payment options. For a ran- domly selected policyholder, let X = the number of months between successive payments. The cdf of X is as follows: F(x)=0.00 : x < 10.30 : 1≤x<30.40 : 3≤ x < 40.45 : 4≤ x <60.60 : 6≤ x < 121.00 : 12≤ x a. What is the pmf of X?b. Using just the cdf, compute P(3≤ X ≤6) and P(4≤ X).arrow_forward59. At a certain gas station, 40% of the customers use regular gas (A1), 35% use plus gas (A2), and 25% use premium (A3). Of those customers using regular gas, only 30% fill their tanks (event B). Of those customers using plus, 60% fill their tanks, whereas of those using premium, 50% fill their tanks.a. What is the probability that the next customer will request plus gas and fill the tank (A2 B)?b. What is the probability that the next customer fills the tank?c. If the next customer fills the tank, what is the probability that regular gas is requested? Plus? Premium?arrow_forward38. Possible values of X, the number of components in a system submitted for repair that must be replaced, are 1, 2, 3, and 4 with corresponding probabilities .15, .35, .35, and .15, respectively. a. Calculate E(X) and then E(5 - X).b. Would the repair facility be better off charging a flat fee of $75 or else the amount $[150/(5 - X)]? [Note: It is not generally true that E(c/Y) = c/E(Y).]arrow_forward
- 74. The proportions of blood phenotypes in the U.S. popula- tion are as follows:A B AB O .40 .11 .04 .45 Assuming that the phenotypes of two randomly selected individuals are independent of one another, what is the probability that both phenotypes are O? What is the probability that the phenotypes of two randomly selected individuals match?arrow_forward53. A certain shop repairs both audio and video compo- nents. Let A denote the event that the next component brought in for repair is an audio component, and let B be the event that the next component is a compact disc player (so the event B is contained in A). Suppose that P(A) = .6 and P(B) = .05. What is P(BA)?arrow_forward26. A certain system can experience three different types of defects. Let A;(i = 1,2,3) denote the event that the sys- tem has a defect of type i. Suppose thatP(A1) = .12 P(A) = .07 P(A) = .05P(A, U A2) = .13P(A, U A3) = .14P(A2 U A3) = .10P(A, A2 A3) = .011Rshelfa. What is the probability that the system does not havea type 1 defect?b. What is the probability that the system has both type 1 and type 2 defects?c. What is the probability that the system has both type 1 and type 2 defects but not a type 3 defect? d. What is the probability that the system has at most two of these defects?arrow_forward
- The following are suggested designs for group sequential studies. Using PROCSEQDESIGN, provide the following for the design O’Brien Fleming and Pocock.• The critical boundary values for each analysis of the data• The expected sample sizes at each interim analysisAssume the standardized Z score method for calculating boundaries.Investigators are evaluating the success rate of a novel drug for treating a certain type ofbacterial wound infection. Since no existing treatment exists, they have planned a one-armstudy. They wish to test whether the success rate of the drug is better than 50%, whichthey have defined as the null success rate. Preliminary testing has estimated the successrate of the drug at 55%. The investigators are eager to get the drug into production andwould like to plan for 9 interim analyses (10 analyzes in total) of the data. Assume thesignificance level is 5% and power is 90%.Besides, draw a combined boundary plot (OBF, POC, and HP)arrow_forwardPlease provide the solution for the attached image in detailed.arrow_forward20 km, because GISS Worksheet 10 Jesse runs a small business selling and delivering mealie meal to the spaza shops. He charges a fixed rate of R80, 00 for delivery and then R15, 50 for each packet of mealle meal he delivers. The table below helps him to calculate what to charge his customers. 10 20 30 40 50 Packets of mealie meal (m) Total costs in Rands 80 235 390 545 700 855 (c) 10.1. Define the following terms: 10.1.1. Independent Variables 10.1.2. Dependent Variables 10.2. 10.3. 10.4. 10.5. Determine the independent and dependent variables. Are the variables in this scenario discrete or continuous values? Explain What shape do you expect the graph to be? Why? Draw a graph on the graph provided to represent the information in the table above. TOTAL COST OF PACKETS OF MEALIE MEAL 900 800 700 600 COST (R) 500 400 300 200 100 0 10 20 30 40 60 NUMBER OF PACKETS OF MEALIE MEALarrow_forward
 Algebra & Trigonometry with Analytic GeometryAlgebraISBN:9781133382119Author:SwokowskiPublisher:Cengage