
Concept explainers
Videos
In some cases, users want to use Access and Excel together. They process relational data with Access, import some of the data into Excel, and use Excel’s tools for creating professional-looking charts and graphs. You will do exactly that in this exercise.
FIGURE AE-3 Data Displayed in Pie-Chart Format
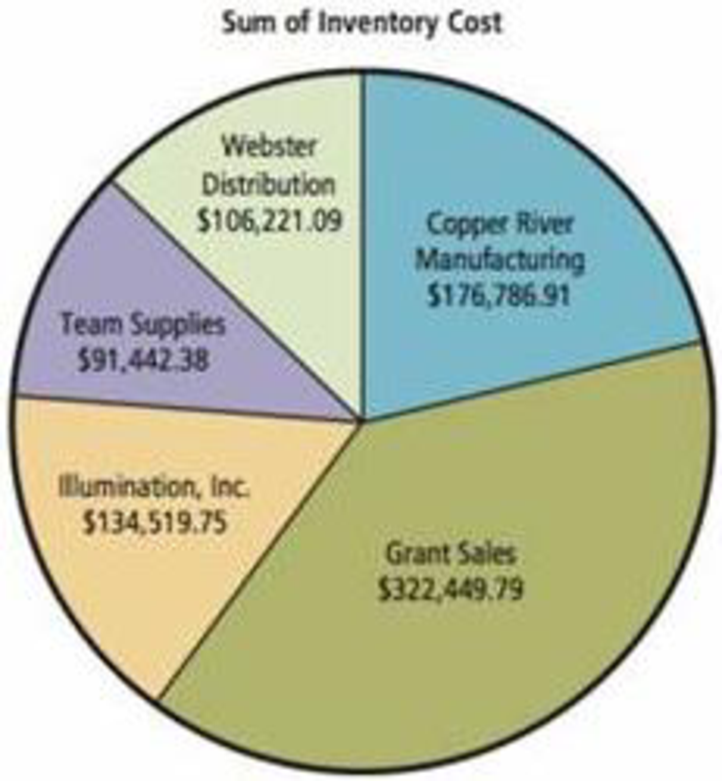
Source: Microsoft Corporation
Download the Access file Ch05Ex01_U10e.accdb. Open the
For this problem, we will define InventoryCost as the product of Industry-Standard-Cost and QuantityOnHand. The query InventoryCost computes these values for every item in inventory for every vendor. Open that query and view the data to be certain you understand this computation. Open the other queries as well so that you understand the data they produce.
- a. Sum this data by vendor and display it in a pie chart like that shown in Figure AE-3 (your totals will be different from those shown). Proceed as follows:
- (1) Open Excel and create a new spreadsheet.
- (2) Click DATA on the ribbon and select From Access in the Get External Data ribbon category.
- (3) Navigate to the location in which you have stored the Access file Ch05Ex01_U10e.accdb.
- (4) Select the query that contains the data you need for this pie chart.
- (5) Import the data into a worksheet.
- (6) Format the appropriate data as currency.
- (7) Select the range that contains the data, press the Function key, and proceed from there to create the pie chart. Name the data and pie chart worksheets appropriately.
h. Follow a similar procedure to create the bar chart shown in Figure AE-4. Again, your data will be different. Place the data and the chart in separate worksheets and name them appropriately.
FIGURE AE-4 Data Displayed in Bar-Chart Format
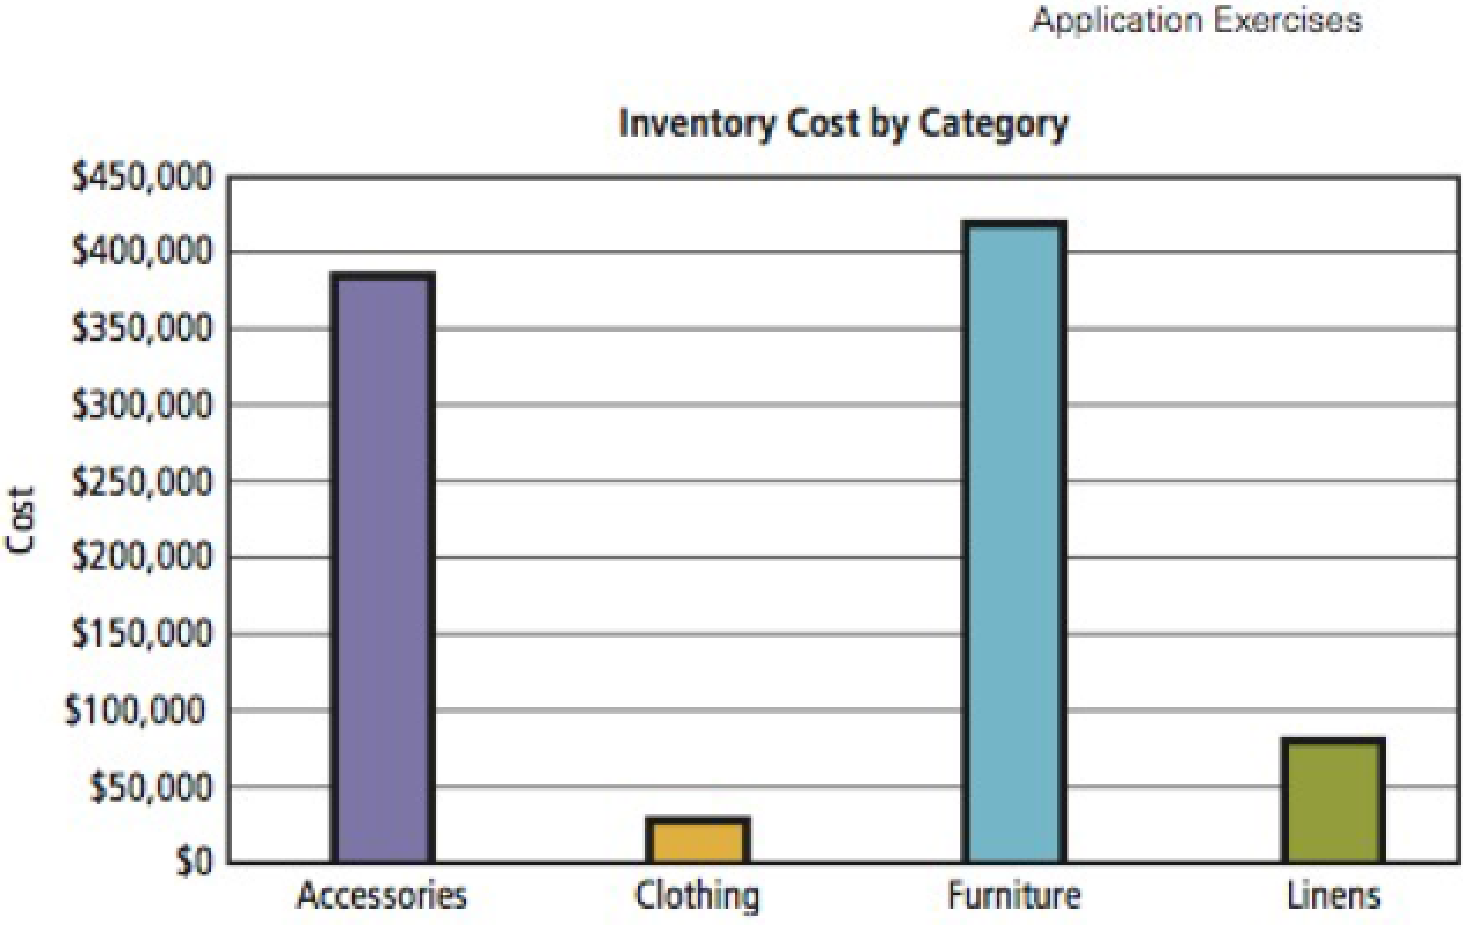
Source: Microsoft Corporation
Want to see the full answer?
Check out a sample textbook solution
Chapter AE Solutions
EBK USING MIS
Additional Engineering Textbook Solutions
Starting Out with Programming Logic and Design (5th Edition) (What's New in Computer Science)
SURVEY OF OPERATING SYSTEMS
Database Concepts (8th Edition)
Modern Database Management
Automotive Technology: Principles, Diagnosis, And Service (6th Edition) (halderman Automotive Series)
Thinking Like an Engineer: An Active Learning Approach (4th Edition)


- Considering the TM example of binary sum ( see attached)do the step-by-step of execution for the binary numbers 1101 and 11. Feel free to use the Formal Language Editor Tool to execute it; Write it down the current state of the tape (including the head position) and indicate the current state of the TM at each step.arrow_forwardI need help on inculding additonal code where I can can do the opposite code of MatLab, where the function of t that I enter becomes the result of F(t), in other words, turning the time-domain f(t) into the frequency-domain function F(s):arrow_forwardI need help with the TM computation step-by-step execution for the binary numbers 1101 and 11. Formal Language Editor Tool can be used to execute it; Write it down the current state of the tape (including the head position) and indicate the current state of the TM at each step;arrow_forward
 Np Ms Office 365/Excel 2016 I NtermedComputer ScienceISBN:9781337508841Author:CareyPublisher:Cengage
 A Guide to SQLComputer ScienceISBN:9781111527273Author:Philip J. PrattPublisher:Course Technology Ptr
 Database Systems: Design, Implementation, & Manag...Computer ScienceISBN:9781305627482Author:Carlos Coronel, Steven MorrisPublisher:Cengage Learning
 Database Systems: Design, Implementation, & Manag...Computer ScienceISBN:9781285196145Author:Steven, Steven Morris, Carlos Coronel, Carlos, Coronel, Carlos; Morris, Carlos Coronel and Steven Morris, Carlos Coronel; Steven Morris, Steven Morris; Carlos CoronelPublisher:Cengage Learning