Videos
Mary Williams, owner of Williams Products, is evaluating whether to introduce a new product line. After thinking through the production process and the costs of raw materials and new equipment, Williams estimates the variable costs of each unit produced and sold at $6 and the fixed costs per year at $60,000.
- If the selling price is set at $18 each, how many unit must be produced and sold for Williams to break even? Use both graphic and algebraic approaches to get your answer.
- Williams
forecasts sales of 10,000 units for the first year if the selling price is set at $14 each. What would be the total contribution to profits from this new product during the first year? - If the selling price is set at $12.50, Williams forecasts that first-year sales would increase to 15,000 units. Which pricing strategy ($14.00 or $12.50) would result in the greater total contribution to profits?
- What oilier considerations would be crucial to the final decision about making and marketing the new product?
a.
To calculate: The break even quantity using both graphic and algebraic approaches.
Concept Introduction: Break-even point is explained as a point where a company is earning no profits and incurring no losses reflecting that total cost is equivalent to total income.
Explanation of Solution
Given information:
Variable costs: $6 per unit
Fixed costs: $60,000
Selling price: $18 per unit
Break-even quantity: ?
Calculation of break even quantity:
Hence, the break even quantity is 5,000 units.
Graphic approach for calculating break even quantity:
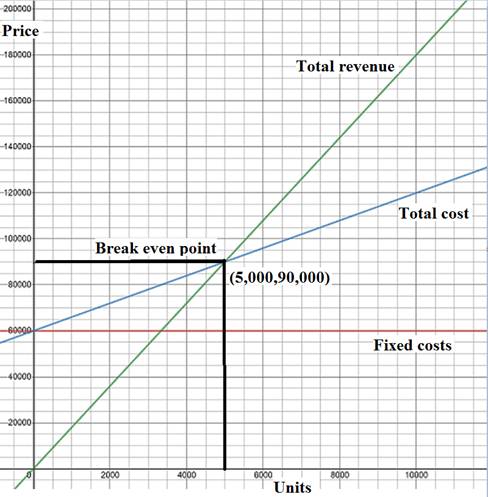
Fig (1)
b.
To calculate: The total contribution to profits from this new product.
Concept Introduction: Profit is explained as surplus of total income over total costs.
Explanation of Solution
Given information:
Forecasted sales: 10,000 units
Selling price: $14 per unit
Calculation of total contribution to the profits:
Therefore, the total contribution from the new product is $20,000.
c.
To calculate: The total contribution to profits from this new product if selling price is $12.50.
Concept Introduction: Profit is explained as surplus of total income over total costs.
Explanation of Solution
Given information:
Forecasted sales: 15,000 units
Selling price: $12.50 per unit
Calculation of total contribution to the profits:
Therefore, the total contribution from the new product is $37,500.
If selling price is $14 and forecasted sales are 15,000 units, then,
Calculation of total contribution to the profits:
It can be concluded that when selling price is $14 then it can get a greater total contribution to Company W.
d.
To identify: The other considerations that would be crucial for final decision making for the new product.
Concept Introduction: Decision making is a process in which members of an organization select a particular course of action in response to both problem and opportunity. The objective of decision making is to gain a maximum and profitable result.
Explanation of Solution
Other considerations that would be crucial for final decision making of new product are:
- Company W can identify and evidently state the problems.
- Various other alternatives should be evaluated and for the same information should be collected.
Decisions are taken by organizations on the basis these procedures that are generally performed: break even analysis, decision tree, preference matrix and preference decision tree.
Want to see more full solutions like this?
Chapter A Solutions
Operations Management: Processes And Supply Chains (12th Edition) (what's New In Operations Management)
Additional Business Textbook Solutions
Gitman: Principl Manageri Finance_15 (15th Edition) (What's New in Finance)
Microeconomics
Principles of Operations Management: Sustainability and Supply Chain Management (10th Edition)
Marketing: An Introduction (13th Edition)
Intermediate Accounting (2nd Edition)
Horngren's Cost Accounting: A Managerial Emphasis (16th Edition)


- qusestion 6. An electrical engineering company is designing two types of solar panel systems: Standard Panels (S) and High-Efficiency Panels (H). The company has certain constraints regarding the hours of labor and material available for production each week. Each Standard Panel requires 4 hours of labor and 2 units of material and each High-Efficiency Panel requires 3 hours of labor and 5 units of material. The company has a maximum of 60 hours of labor and 40 units of material available per week. The profit from each Standard Panel is GH¢80, and the profit from each High-Efficiency Panel is GH¢100. The company wants to determine how many of each type of panel to produce in order to maximize profit. i. Formulate a linear programming model of the problem for the company. ii Convert the linear programming model formulated in (a) to a standard form.arrow_forwardG ווח >>> Mind Tap Cengage Learning 1- CENGAGE MINDTAP Chapter 09 Excel Activity: Exponential Smoothing Question 1 3.33/10 e Submit 自 A ng.cengage.com C Excel Online Student Work G A retail store records customer demand during each sales period. 1. What is the f... Q Search this course ? ✓ Co Excel Online Tutorial Excel Online Activity: Exponential Smoothing A-Z A retail store records customer demand during each sales period. The data has been collected in the Microsoft Excel Online file below. Use the Microsoft Excel Online file below to develop the single exponential smoothing forecast and answer the following questions. Office Video X Open spreadsheet Questions 1. What is the forecast for the 13th period based on the single exponential smoothing? Round your answer to two decimal places. 25.10 2. What is the MSE for the single exponential smoothing forecast? Round your answer to two decimal places. 21.88 Activity Frame ? 3. Choose the correct graph for the single exponential…arrow_forwardNot use ai pleasearrow_forward
- Items removed from the work area (5S) were taken to a storage area called ___________. Choose from: SORT, STORD, KNUJ, STUFF, FUDG SORT STORD KNUJ STUFF FUDGarrow_forwardCould you please help explain How was the poor strategic decisions lead to economic downturns of Circuit City Company? What are the sequences of key events and problems that contribute to its collapse. Could you please explain each one them and give the examples If Circuit City would apply Lean Six Sigma. would it helped prevent businesses from collapsed?? How Qualitative and quantitative Research Methodology in Case Study Research would affect Circuit City?arrow_forwardApple is a global technology company renowned for its innovation and design. To create its products, Apple has established a world class global supply chain to bring their products to market. What strategies is Apple using to source and manufacture its products? How does Apple view its responsibility to its suppliers and those who build its products?arrow_forward
- Critical Path Method (CPM) is an important Project Management Tool that has wide industry application in modern day Project Management. By using an example of the project of your choice, critically examine the practical application of CPM as a Project Management Tool.arrow_forwardwhat is an other difination for principle?arrow_forwardNeed help or ideas to design out two slides as my script and writing quite long to squeese into two slides. But can just point form in slides with correct title and a good script for me to present two slides in only 2.5 mins. Following is my draft, pls guide me step by step on powerpoint creation and good script to present findings. My draft: Slide 1: Foreign Labor Exploitation in Dyson's Supply Chain Introduction Dyson's former Malaysian supplier, ATA IMS Bhd, became embroiled in serious labor exploitation allegations in 2021. These concerns surfaced when whistleblowers exposed unethical labor practices affecting migrant workers, primarily from Nepal and Bangladesh. Key Forms of Exploitation Debt Bondage Due to Recruitment Fees Workers were forced to pay exorbitant recruitment fees before securing employment, often taking loans at high interest rates. This financial burden trapped them in debt bondage, leaving them with little choice but to accept exploitative working…arrow_forward
- Not use ai pleasearrow_forwardThe Business Development Bank of Canada. (2023). Canadian economic outlook for 2024: Shifting into neutral. https://www.bdc.ca/en/articles-tools/blog/canadian-economic-outlook-for-2024-shifting-into-neutral “Despite persistently high inflation and rising interest rates, the news was generally better than expected for the Canadian economy in 2023” (BDC Blog 2024). Discussion Question: In your view, what are the most pressing problems for Canadian companies or consumers in 2024? Explain your answer using current examples of companies or consumer concerns.arrow_forwardhow have idividual objectives led to the current situation at TeraCog? what should Emaa do?arrow_forward
 MarketingMarketingISBN:9780357033791Author:Pride, William MPublisher:South Western Educational Publishing
 Purchasing and Supply Chain ManagementOperations ManagementISBN:9781285869681Author:Robert M. Monczka, Robert B. Handfield, Larry C. Giunipero, James L. PattersonPublisher:Cengage Learning
 Contemporary MarketingMarketingISBN:9780357033777Author:Louis E. Boone, David L. KurtzPublisher:Cengage Learning