
Introductory Statistics (10th Edition)
10th Edition
ISBN: 9780321989178
Author: Neil A. Weiss
Publisher: PEARSON
expand_more
expand_more
format_list_bulleted
Videos
Textbook Question
Chapter A, Problem 1CSD
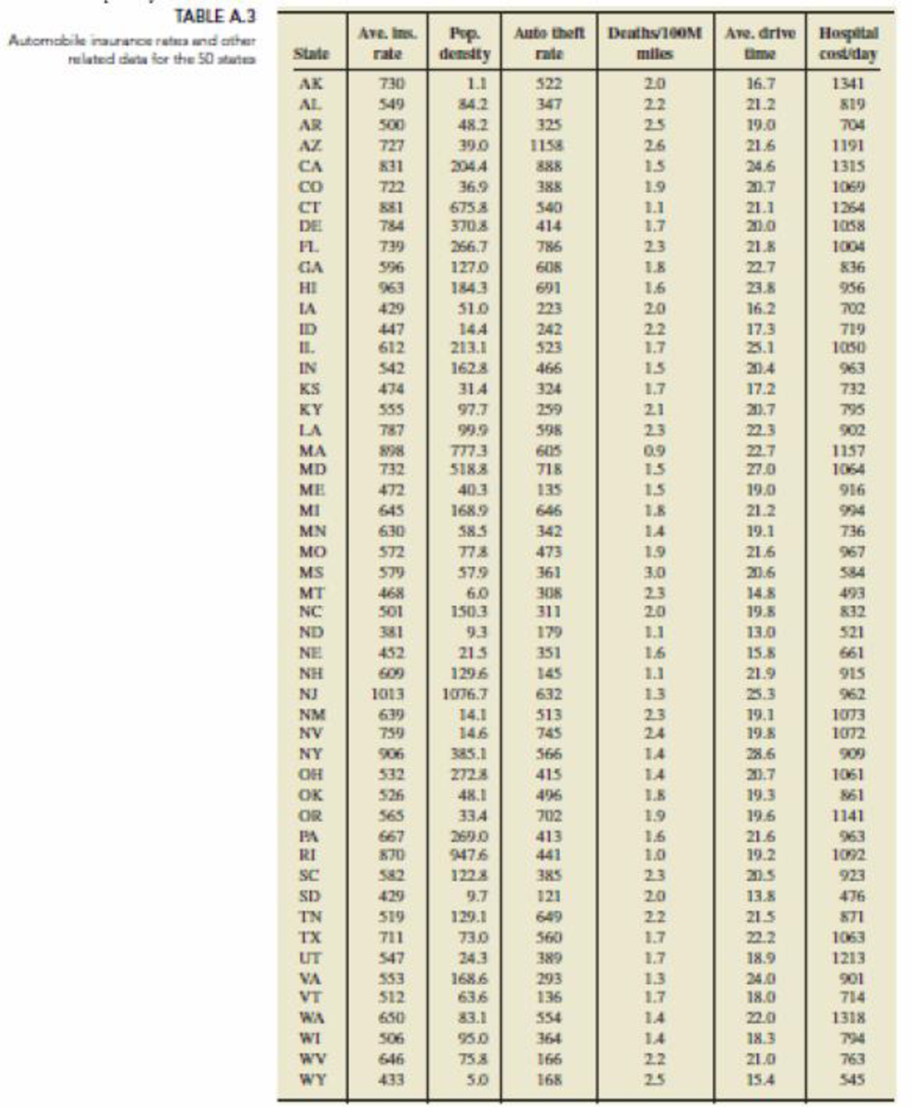
At the beginning of this module on page A-0, we discussed studying the effect various factors might have on the average automobile insurance rate in a state. Data were obtained from the Statistical Abstract of the United States for each of the 50 states on the response variable, average automobile insurance rate, and five predictor variables: population density, automobile theft rate, automobile death rate per 100 million miles driven, average drive time to work, and average cost of a day's stay in a hospital. The data are shown in Table A3. Using the technology of your choice, answer the following questions. The data are on the WeissStats site.
- a. Draw a
scatterplot matrix of the data for the six variables. What do these scatterplots tell you about the relationship among the variables? - b. Does a multiple linear regression equation relating insurance rate to the five predictor variables seem appropriate for these data? Explain your answer.
- c. Find the multiple linear regression equation relating the response variable of insurance rate to the five predictor variables.
- d. Interpret the sample regression coefficients.
- e. Determine the proportion of variation in the observed insurance rates that can be accounted for by the multiple linear regression equation in the five predictor variables.
- f. Should all of the predictors remain in the regression equation?
- g. Construct residual plots and assess the appropriateness of the multiple linear regression equation.
- h. Construct residual plots to assess the assumptions of constant conditional standard deviation and normality.
- i. Identify potential outliers and influential observations.
- j. Do you think these predictor variables do a good job of predicting the response?
- k. Suggest other possible variables that should be considered as predictors in this regression model.
Expert Solution & Answer
Want to see the full answer?
Check out a sample textbook solution
Students have asked these similar questions
A major company in the Montreal area, offering a range of engineering services from project preparation to construction execution, and industrial project management, wants to ensure that the individuals who are responsible for project cost estimation and bid preparation demonstrate a certain uniformity in their estimates. The head of civil engineering and municipal services decided to structure an experimental plan to detect if there could be significant differences in project evaluation.
Seven projects were selected, each of which had to be evaluated by each of the two estimators, with the order of the projects submitted being random. The obtained estimates are presented in the table below.
a) Complete the table above by calculating: i. The differences (A-B) ii. The sum of the differences iii. The mean of the differences iv. The standard deviation of the differences
b) What is the value of the t-statistic?
c) What is the critical t-value for this test at a significance level of 1%?…
Compute the relative risk of falling for the two groups (did not stop walking vs. did stop). State/interpret your result verbally.
Microsoft Excel include formulas
Chapter A Solutions
Introductory Statistics (10th Edition)
Ch. A.1 - A. 1 Regarding linear equations in two or more...Ch. A.1 - Fill in the blanks. a. The graph of a linear...Ch. A.1 - Consider a linear equation y = b0 + b1x1 + b2x2. ...Ch. A.1 - Prob. 4ECh. A.1 - Prob. 5ECh. A.1 - Prob. 6ECh. A.1 - Banquet Room Rental. The banquet room at the...Ch. A.1 - Prob. 8ECh. A.1 - In each of Exercises A.9A.12, a. determine the...Ch. A.1 - In each of Exercises A.9A.12, a. determine the...
Ch. A.1 - In each of Exercises A.9A.12, a. determine the...Ch. A.1 - In each of Exercises A.9A.12, a. determine the...Ch. A.1 - Prob. 13ECh. A.1 - Prob. 14ECh. A.1 - Prob. 15ECh. A.1 - In each of Exercises A.13A.22, you are given the...Ch. A.1 - Prob. 17ECh. A.1 - Prob. 18ECh. A.1 - In each of Exercises A.13A.22, you are given the...Ch. A.1 - Prob. 20ECh. A.1 - Prob. 21ECh. A.1 - In each of Exercises A.13A.22, you are given the...Ch. A.1 - In each of Exercises A.23A.30, we have identified...Ch. A.1 - Prob. 24ECh. A.1 - Prob. 25ECh. A.1 - Prob. 26ECh. A.1 - In each of Exercises A.23A.30, we have identified...Ch. A.1 - Prob. 28ECh. A.1 - Prob. 29ECh. A.1 - Prob. 30ECh. A.1 - Why is it often preferable to use more than one...Ch. A.1 - Grade Prediction. The Statistics Department at a...Ch. A.1 - Prob. 33ECh. A.1 - Blood Pressure Medication. A medical researcher...Ch. A.1 - Infant Mortality Rate. A social scientist wants to...Ch. A.2 - Regarding a scatterplot matrix: a. Identify two of...Ch. A.2 - Regarding the criterion used to decide tits a set...Ch. A.2 - Prob. 38ECh. A.2 - Regarding the variables in a multiple linear...Ch. A.2 - Answer true or false to the following statements...Ch. A.2 - In each of Exercises A.41 and A.42, a. construct...Ch. A.2 - In each of Exercises A.41 and A.42, a. construct...Ch. A.2 - Advertising and Sales. A household-appliance...Ch. A.2 - Corvette Prices. The data on age and price for 10...Ch. A.2 - Graduation Kales. Graduation rates and what...Ch. A.2 - Custom Home Resales. Hanna Properties specializes...Ch. A.2 - Advertising and Sales. Refer to Exercise A.43. Use...Ch. A.2 - Prob. 48ECh. A.2 - Graduation Rates. Refer to Exercise A.45. Use the...Ch. A.2 - Custom Home Resales. Refer to Exercise A.46. Use...Ch. A.3 - Fill in the blanks. a. A measure of total...Ch. A.3 - In this section we introduced a descriptive...Ch. A.3 - Suppose x1, x2, and x3 are predictor variables and...Ch. A.3 - State the four conditions required for making...Ch. A.3 - In each of Exercises A.55A.59, assume the...Ch. A.3 - In each of Exercises A.55A.59, assume the...Ch. A.3 - In each of Exercises A.55A.59, assume the...Ch. A.3 - Prob. 58ECh. A.3 - In each of Exercises A.55A.59, assume the...Ch. A.3 - Fill in the blanks. a. When a sum of squares is...Ch. A.3 - Answer true or false to the following statements...Ch. A.3 - For a particular multiple linear regression...Ch. A.3 - For a particular multiple linear regression...Ch. A.3 - Advertising and Sales. Refer to Exercise A.43 on...Ch. A.3 - Corvette Prices. Refer to Exercise A.44 on page...Ch. A.3 - Graduation Rates. Refer to Exercise A.45 on page...Ch. A.3 - Custom Home Resales. Refer to Exercise A.46 on...Ch. A.3 - Advertising and Sales. Refer to Exercise A.43 on...Ch. A.3 - Corvette Prices. Refer to Exercise A.44 on page...Ch. A.3 - Graduation Rates. Refer to Exercise A.45 on page...Ch. A.3 - Custom Home Resales. Refer to Exercise A.46 on...Ch. A.3 - Suppose that R2 = 1 for a data set. What can you...Ch. A.3 - Suppose that R2 = 0 for a data set. What can you...Ch. A.3 - Use the regression identity for multiple linear...Ch. A.4 - Explain why the predictor variables are useless as...Ch. A.4 - Prob. 76ECh. A.4 - What test statistic is used for a hypothesis test...Ch. A.4 - Answer line or false to the following statements...Ch. A.4 - Advertising and Sales. Refer to Exercise A.43 oil...Ch. A.4 - Prob. 80ECh. A.4 - Graduation Rates. Refer to Exercise A.45 on page...Ch. A.4 - Custom-Home Resales. Refer to Exercise A.46 on...Ch. A.4 - Advertising and Sales. Referring to Exercise A.79,...Ch. A.4 - Prob. 84ECh. A.4 - Graduation Rates. Referring to Exercise A.81, use...Ch. A.4 - Prob. 86ECh. A.5 - What two regression inferences did we discuss in...Ch. A.5 - Prob. 88ECh. A.5 - A sample multiple linear regression equation...Ch. A.5 - Answer true or false to the following statements...Ch. A.5 - Advertising and Sales. Refer to Exercise A.43 on...Ch. A.5 - Corvette Prices. Refer to Exercise A.44 on page...Ch. A.5 - Graduation Rates. Refer to Exercise A.45 on page...Ch. A.5 - Custom-Home Resales. Refer to Exercise A.46 on...Ch. A.5 - Advertising and Sales. Referring to Exercise A.91,...Ch. A.5 - Corvette Sales. Referring to Exercise A.92, use...Ch. A.5 - Graduation Rates. Referring to Exercise A.93, use...Ch. A.5 - Custom-Home Resales. Referring to Exercise A.94,...Ch. A.6 - Fill in the blanks. a. In multiple linear...Ch. A.6 - Describe the difference between a residual and a...Ch. A.6 - Fill in the blanks. a. In multiple linear...Ch. A.6 - Answer true or false to the following statements...Ch. A.6 - Prob. 103ECh. A.6 - Corvette Prices. Refer to Exercise A.44 on page...Ch. A.6 - Advertising and Sales. Refer to Exercise A.43 on...Ch. A.6 - Corvette Prices. Refer to Exercise A.44 on page...Ch. A.6 - Graduation Rates. Refer to Exercise A.45 on page...Ch. A.6 - Custom-Homes Resales. Refer to Exercise A.46 on...Ch. A - For a linear equation y = b0 + b1x1 + b2x2 + b3x3,...Ch. A - Consider the linear equation y = 5 + 4x1 3x2. a....Ch. A - Answer true or false to each of the following...Ch. A - What kind of plot is useful for deciding whether...Ch. A - Prob. 5RPCh. A - Prob. 6RPCh. A - Regarding multiple linear regression analysis: a....Ch. A - Prob. 8RPCh. A - For each of the following sums of squares in...Ch. A - Prob. 10RPCh. A - Prob. 11RPCh. A - Suppose x1 and x2 are predictor variables for a...Ch. A - Fill in the blanks. a. The F-statistic for a test...Ch. A - Answer true or false to each of the following...Ch. A - Which interval is wider: (a) the 95% confidence...Ch. A - What plots did we use in this module to decide...Ch. A - Regarding analysis of residuals, decide in each...Ch. A - Annual Income. The Census Bureau collects data on...Ch. A - Annual Income. Refer to Problem 18 and the...Ch. A - Annual Income. Refer to Problem 18, Outputs...Ch. A - Recall from Chapter 1 (page 34 of your text) that...Ch. A - At the beginning of this module on page A-0, we...
Knowledge Booster


Learn more about
Need a deep-dive on the concept behind this application? Look no further. Learn more about this topic, statistics and related others by exploring similar questions and additional content below.Similar questions
- Question 1 The data shown in Table 1 are and R values for 24 samples of size n = 5 taken from a process producing bearings. The measurements are made on the inside diameter of the bearing, with only the last three decimals recorded (i.e., 34.5 should be 0.50345). Table 1: Bearing Diameter Data Sample Number I R Sample Number I R 1 34.5 3 13 35.4 8 2 34.2 4 14 34.0 6 3 31.6 4 15 37.1 5 4 31.5 4 16 34.9 7 5 35.0 5 17 33.5 4 6 34.1 6 18 31.7 3 7 32.6 4 19 34.0 8 8 33.8 3 20 35.1 9 34.8 7 21 33.7 2 10 33.6 8 22 32.8 1 11 31.9 3 23 33.5 3 12 38.6 9 24 34.2 2 (a) Set up and R charts on this process. Does the process seem to be in statistical control? If necessary, revise the trial control limits. [15 pts] (b) If specifications on this diameter are 0.5030±0.0010, find the percentage of nonconforming bearings pro- duced by this process. Assume that diameter is normally distributed. [10 pts] 1arrow_forward4. (5 pts) Conduct a chi-square contingency test (test of independence) to assess whether there is an association between the behavior of the elderly person (did not stop to talk, did stop to talk) and their likelihood of falling. Below, please state your null and alternative hypotheses, calculate your expected values and write them in the table, compute the test statistic, test the null by comparing your test statistic to the critical value in Table A (p. 713-714) of your textbook and/or estimating the P-value, and provide your conclusions in written form. Make sure to show your work. Did not stop walking to talk Stopped walking to talk Suffered a fall 12 11 Totals 23 Did not suffer a fall | 2 Totals 35 37 14 46 60 Tarrow_forwardQuestion 2 Parts manufactured by an injection molding process are subjected to a compressive strength test. Twenty samples of five parts each are collected, and the compressive strengths (in psi) are shown in Table 2. Table 2: Strength Data for Question 2 Sample Number x1 x2 23 x4 x5 R 1 83.0 2 88.6 78.3 78.8 3 85.7 75.8 84.3 81.2 78.7 75.7 77.0 71.0 84.2 81.0 79.1 7.3 80.2 17.6 75.2 80.4 10.4 4 80.8 74.4 82.5 74.1 75.7 77.5 8.4 5 83.4 78.4 82.6 78.2 78.9 80.3 5.2 File Preview 6 75.3 79.9 87.3 89.7 81.8 82.8 14.5 7 74.5 78.0 80.8 73.4 79.7 77.3 7.4 8 79.2 84.4 81.5 86.0 74.5 81.1 11.4 9 80.5 86.2 76.2 64.1 80.2 81.4 9.9 10 75.7 75.2 71.1 82.1 74.3 75.7 10.9 11 80.0 81.5 78.4 73.8 78.1 78.4 7.7 12 80.6 81.8 79.3 73.8 81.7 79.4 8.0 13 82.7 81.3 79.1 82.0 79.5 80.9 3.6 14 79.2 74.9 78.6 77.7 75.3 77.1 4.3 15 85.5 82.1 82.8 73.4 71.7 79.1 13.8 16 78.8 79.6 80.2 79.1 80.8 79.7 2.0 17 82.1 78.2 18 84.5 76.9 75.5 83.5 81.2 19 79.0 77.8 20 84.5 73.1 78.2 82.1 79.2 81.1 7.6 81.2 84.4 81.6 80.8…arrow_forward
- Name: Lab Time: Quiz 7 & 8 (Take Home) - due Wednesday, Feb. 26 Contingency Analysis (Ch. 9) In lab 5, part 3, you will create a mosaic plot and conducted a chi-square contingency test to evaluate whether elderly patients who did not stop walking to talk (vs. those who did stop) were more likely to suffer a fall in the next six months. I have tabulated the data below. Answer the questions below. Please show your calculations on this or a separate sheet. Did not stop walking to talk Stopped walking to talk Totals Suffered a fall Did not suffer a fall Totals 12 11 23 2 35 37 14 14 46 60 Quiz 7: 1. (2 pts) Compute the odds of falling for each group. Compute the odds ratio for those who did not stop walking vs. those who did stop walking. Interpret your result verbally.arrow_forwardSolve please and thank you!arrow_forward7. In a 2011 article, M. Radelet and G. Pierce reported a logistic prediction equation for the death penalty verdicts in North Carolina. Let Y denote whether a subject convicted of murder received the death penalty (1=yes), for the defendant's race h (h1, black; h = 2, white), victim's race i (i = 1, black; i = 2, white), and number of additional factors j (j = 0, 1, 2). For the model logit[P(Y = 1)] = a + ß₁₂ + By + B²², they reported = -5.26, D â BD = 0, BD = 0.17, BY = 0, BY = 0.91, B = 0, B = 2.02, B = 3.98. (a) Estimate the probability of receiving the death penalty for the group most likely to receive it. [4 pts] (b) If, instead, parameters used constraints 3D = BY = 35 = 0, report the esti- mates. [3 pts] h (c) If, instead, parameters used constraints Σ₁ = Σ₁ BY = Σ; B = 0, report the estimates. [3 pts] Hint the probabilities, odds and odds ratios do not change with constraints.arrow_forward
- Solve please and thank you!arrow_forwardSolve please and thank you!arrow_forwardQuestion 1:We want to evaluate the impact on the monetary economy for a company of two types of strategy (competitive strategy, cooperative strategy) adopted by buyers.Competitive strategy: strategy characterized by firm behavior aimed at obtaining concessions from the buyer.Cooperative strategy: a strategy based on a problem-solving negotiating attitude, with a high level of trust and cooperation.A random sample of 17 buyers took part in a negotiation experiment in which 9 buyers adopted the competitive strategy, and the other 8 the cooperative strategy. The savings obtained for each group of buyers are presented in the pdf that i sent: For this problem, we assume that the samples are random and come from two normal populations of unknown but equal variances.According to the theory, the average saving of buyers adopting a competitive strategy will be lower than that of buyers adopting a cooperative strategy.a) Specify the population identifications and the hypotheses H0 and H1…arrow_forward
- You assume that the annual incomes for certain workers are normal with a mean of $28,500 and a standard deviation of $2,400. What’s the chance that a randomly selected employee makes more than $30,000?What’s the chance that 36 randomly selected employees make more than $30,000, on average?arrow_forwardWhat’s the chance that a fair coin comes up heads more than 60 times when you toss it 100 times?arrow_forwardSuppose that you have a normal population of quiz scores with mean 40 and standard deviation 10. Select a random sample of 40. What’s the chance that the mean of the quiz scores won’t exceed 45?Select one individual from the population. What’s the chance that his/her quiz score won’t exceed 45?arrow_forward
arrow_back_ios
SEE MORE QUESTIONS
arrow_forward_ios
Recommended textbooks for you
 Big Ideas Math A Bridge To Success Algebra 1: Stu...AlgebraISBN:9781680331141Author:HOUGHTON MIFFLIN HARCOURTPublisher:Houghton Mifflin Harcourt
 Glencoe Algebra 1, Student Edition, 9780079039897...AlgebraISBN:9780079039897Author:CarterPublisher:McGraw Hill
 Linear Algebra: A Modern IntroductionAlgebraISBN:9781285463247Author:David PoolePublisher:Cengage Learning
 Holt Mcdougal Larson Pre-algebra: Student Edition...AlgebraISBN:9780547587776Author:HOLT MCDOUGALPublisher:HOLT MCDOUGAL
 Functions and Change: A Modeling Approach to Coll...AlgebraISBN:9781337111348Author:Bruce Crauder, Benny Evans, Alan NoellPublisher:Cengage Learning
Big Ideas Math A Bridge To Success Algebra 1: Stu...
Algebra
ISBN:9781680331141
Author:HOUGHTON MIFFLIN HARCOURT
Publisher:Houghton Mifflin Harcourt
Glencoe Algebra 1, Student Edition, 9780079039897...
Algebra
ISBN:9780079039897
Author:Carter
Publisher:McGraw Hill
Linear Algebra: A Modern Introduction
Algebra
ISBN:9781285463247
Author:David Poole
Publisher:Cengage Learning
Holt Mcdougal Larson Pre-algebra: Student Edition...
Algebra
ISBN:9780547587776
Author:HOLT MCDOUGAL
Publisher:HOLT MCDOUGAL
Functions and Change: A Modeling Approach to Coll...
Algebra
ISBN:9781337111348
Author:Bruce Crauder, Benny Evans, Alan Noell
Publisher:Cengage Learning
what is Research Design, Research Design Types, and Research Design Methods; Author: Educational Hub;https://www.youtube.com/watch?v=LpmGSioXxdo;License: Standard YouTube License, CC-BY