Concept explainers
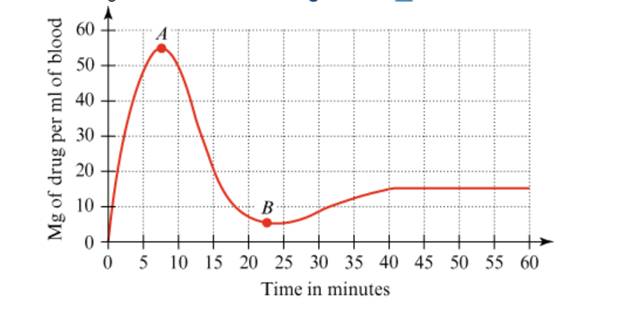
A patient receives a drug. This situation gives rise to a drug function for which the input is the time elapsed since the drug was administered and the output is the amount of the drug in the patient’s blood (in milligrams per milliliter of blood). The graph of this drug function is shown in Figure 9.60 .

Figure 9.60 The graph of a Drug function
- Give the approximate coordinates of point A, and discuss the significance of this point in terms of the scenario about the patient and the drug.
- Give the approximate coordinates of point B, and discuss the significance of this point in terms of the scenario about the patient and the drug.
- Overall, discuss what the graph tells you about the patient and the drug.
Want to see the full answer?
Check out a sample textbook solution
Chapter 9 Solutions
Mathematics for Elementary Teachers with Activities, Loose-Leaf Version Plus MyLab Math -- Access Card Package (5th Edition)
Additional Math Textbook Solutions
University Calculus: Early Transcendentals (4th Edition)
Pathways To Math Literacy (looseleaf)
Precalculus: Mathematics for Calculus (Standalone Book)
A First Course in Probability (10th Edition)
Finite Mathematics for Business, Economics, Life Sciences and Social Sciences
Calculus: Early Transcendentals (2nd Edition)
- Q / solving ha place equation a x x + u y y = 0 u (x, 0)=0 u ( x, 2) = 10 u (o,y) = 4 (119)=0 и on Rectangular Rejonarrow_forward(a) Test the hypothesis. Consider the hypothesis test Ho = : against H₁o < 02. Suppose that the sample sizes aren₁ = 7 and n₂ = 13 and that $² = 22.4 and $22 = 28.2. Use α = 0.05. Ho is not ✓ rejected. 9-9 IV (b) Find a 95% confidence interval on of 102. Round your answer to two decimal places (e.g. 98.76).arrow_forwardLet us suppose we have some article reported on a study of potential sources of injury to equine veterinarians conducted at a university veterinary hospital. Forces on the hand were measured for several common activities that veterinarians engage in when examining or treating horses. We will consider the forces on the hands for two tasks, lifting and using ultrasound. Assume that both sample sizes are 6, the sample mean force for lifting was 6.2 pounds with standard deviation 1.5 pounds, and the sample mean force for using ultrasound was 6.4 pounds with standard deviation 0.3 pounds. Assume that the standard deviations are known. Suppose that you wanted to detect a true difference in mean force of 0.25 pounds on the hands for these two activities. Under the null hypothesis, 40 = 0. What level of type II error would you recommend here? Round your answer to four decimal places (e.g. 98.7654). Use a = 0.05. β = i What sample size would be required? Assume the sample sizes are to be equal.…arrow_forward
- = Consider the hypothesis test Ho: μ₁ = μ₂ against H₁ μ₁ μ2. Suppose that sample sizes are n₁ = 15 and n₂ = 15, that x1 = 4.7 and X2 = 7.8 and that s² = 4 and s² = 6.26. Assume that o and that the data are drawn from normal distributions. Use απ 0.05. (a) Test the hypothesis and find the P-value. (b) What is the power of the test in part (a) for a true difference in means of 3? (c) Assuming equal sample sizes, what sample size should be used to obtain ẞ = 0.05 if the true difference in means is - 2? Assume that α = 0.05. (a) The null hypothesis is 98.7654). rejected. The P-value is 0.0008 (b) The power is 0.94 . Round your answer to four decimal places (e.g. Round your answer to two decimal places (e.g. 98.76). (c) n₁ = n2 = 1 . Round your answer to the nearest integer.arrow_forwardConsider the hypothesis test Ho: = 622 against H₁: 6 > 62. Suppose that the sample sizes are n₁ = 20 and n₂ = 8, and that = 4.5; s=2.3. Use a = 0.01. (a) Test the hypothesis. Round your answers to two decimal places (e.g. 98.76). The test statistic is fo = i The critical value is f = Conclusion: i the null hypothesis at a = 0.01. (b) Construct the confidence interval on 02/022 which can be used to test the hypothesis: (Round your answer to two decimal places (e.g. 98.76).) iarrow_forwardConjecture Let x and y be integers. If x is even and y is odd, then xy is even. Try some examples. Does the conjecture seem to be true or false?arrow_forward
- Find the general solution to the differential equationarrow_forward3. A room has a large circular table with ten seats, numbered 1 to 10, such that to the right of seat number i is seat number i + 1 for all i ∈ {1, . . . , 9} and to the right of seat 10 is seat 1. We want to assign seats to 10 people, 6 of them only speak Slovene, 1 of them only speaks English, and the remaining 3 speak both Slovene and English, by giving out numbered place cards. In how many ways can we do that so that everyone sits next to at least one person who speaks a common language?arrow_forwardcharity savings Budget for May travel food Peter earned $700 during May. The graph shows how the money was used. What fraction was clothes? O Search Submit clothes leisurearrow_forward
- Exercise 11.3 A slope field is given for the equation y' = 4y+4. (a) Sketch the particular solution that corresponds to y(0) = −2 (b) Find the constant solution (c) For what initial conditions y(0) is the solution increasing? (d) For what initial conditions y(0) is the solution decreasing? (e) Verify these results using only the differential equation y' = 4y+4.arrow_forwardSOLVE ONLY FOR (L) (M) AND (O)arrow_forwardAphids are discovered in a pear orchard. The Department of Agriculture has determined that the population of aphids t hours after the orchard has been sprayed is approximated by N(t)=1800−3tln(0.17t)+t where 0<t≤1000. Step 1 of 2: Find N(63). Round to the nearest whole number.arrow_forward
- Algebra & Trigonometry with Analytic GeometryAlgebraISBN:9781133382119Author:SwokowskiPublisher:Cengage
 Mathematics For Machine TechnologyAdvanced MathISBN:9781337798310Author:Peterson, John.Publisher:Cengage Learning,
 Trigonometry (MindTap Course List)TrigonometryISBN:9781305652224Author:Charles P. McKeague, Mark D. TurnerPublisher:Cengage Learning
  Functions and Change: A Modeling Approach to Coll...AlgebraISBN:9781337111348Author:Bruce Crauder, Benny Evans, Alan NoellPublisher:Cengage Learning


