a.
To determine:
The order of the three genes on the phage chromosome.
Introduction:
The E.coli is infected by the two strains of phage
a.
Explanation of Solution
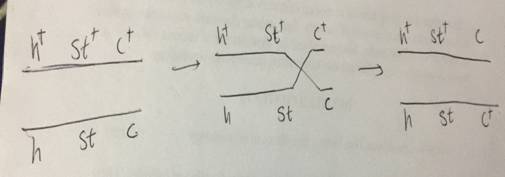
Pictorial representation:
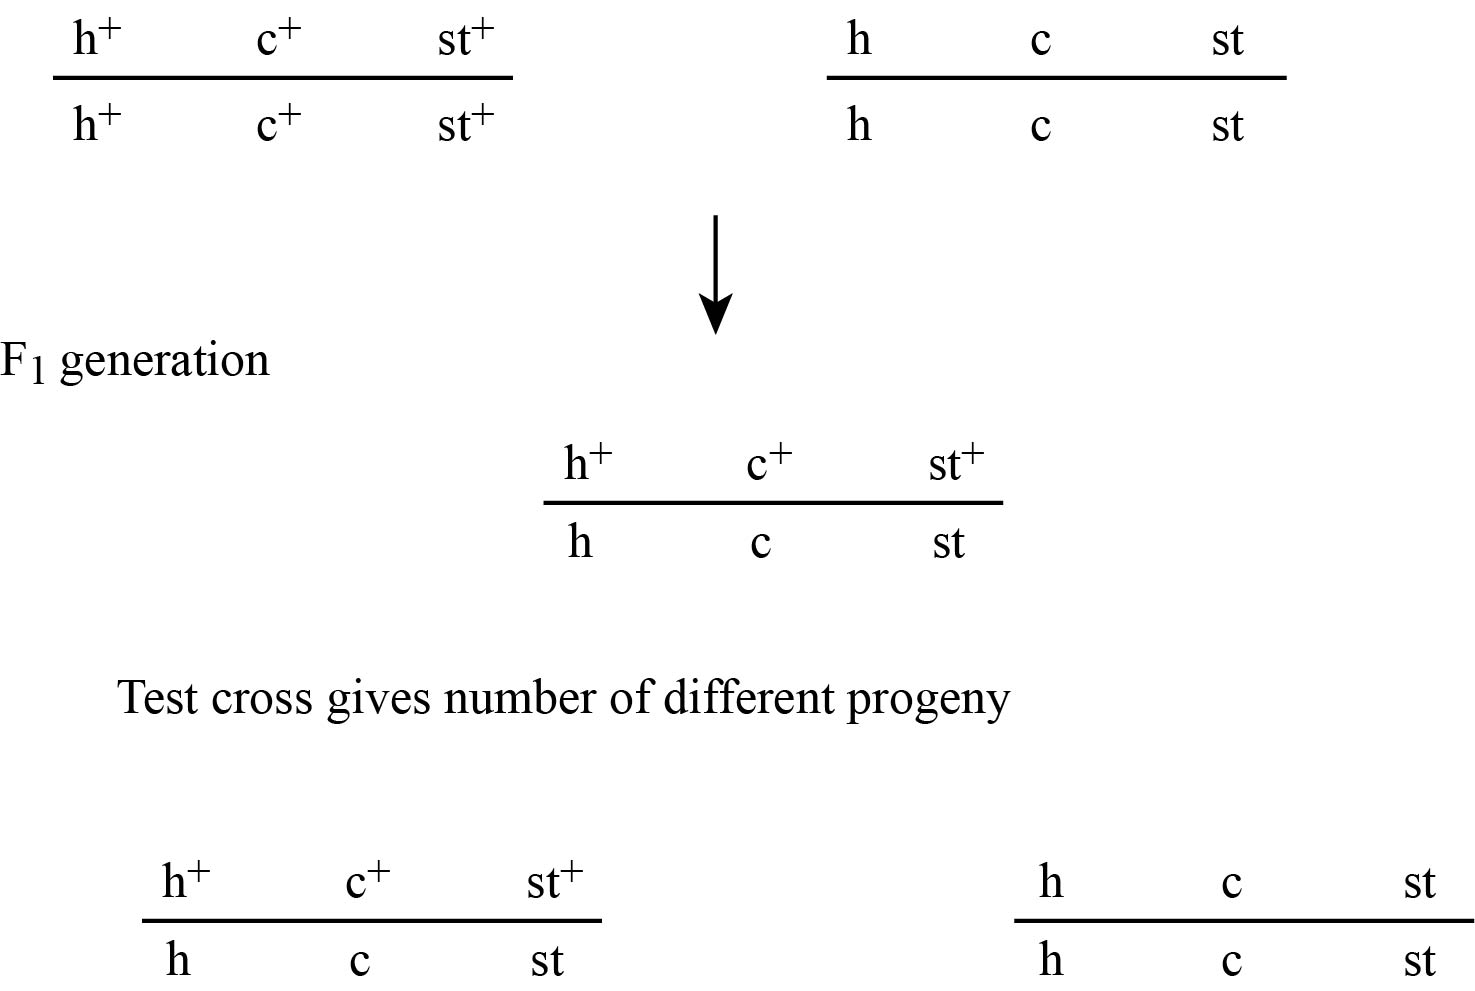
Figure 1(a)
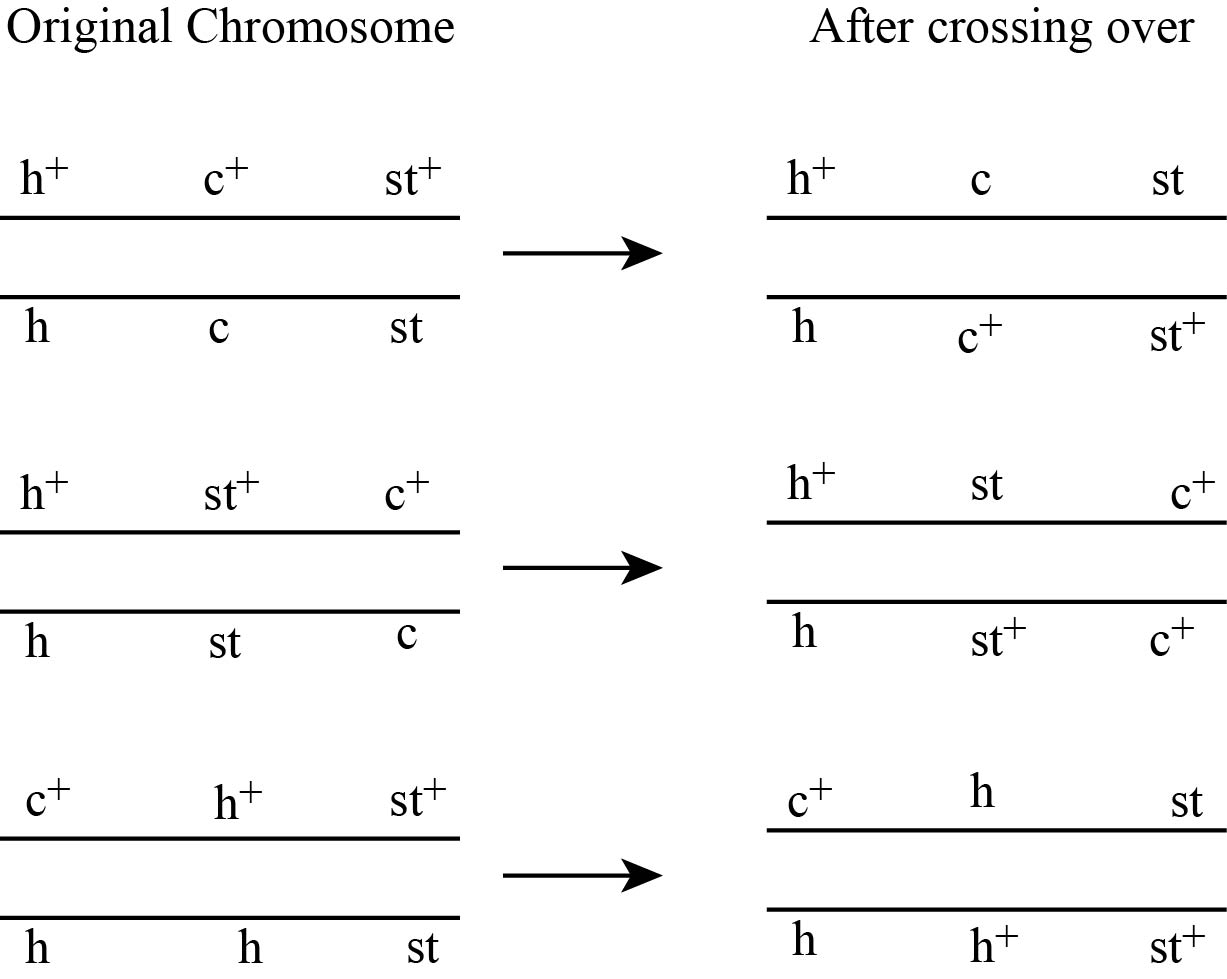
Figure 1(b)
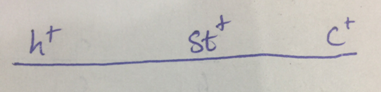
Figure 1(c)
In figure no 1(a), the F1 generation obtained is used to find the order of genes. The possibilities that the genes could be placed in three orders are.
Gene c in the middle and it may be h c st
Gene h in the middle and it may be c hst
Gene st in the middle and it may be h st c
The chromosome which produces same set of alleles which the change in the middle locus is h+ st+ c+ and h stc . In other two chromosomes, two genes change their place. So, here the order of genes is shown in fig no,. 1(c)
b.
To determine:
The map distance between the genes.
Introduction:
The distance between the genes is mapped or measured by crossing over and determing the recombination frequency. The recombination may be singlecross over, double cross over, recombinant or non-recombinant.
b.
Explanation of Solution
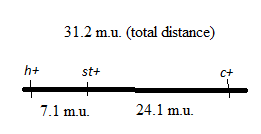
Pictorial representation:
Fig 2 (a) Crossing over between the genes h and st is as follows:
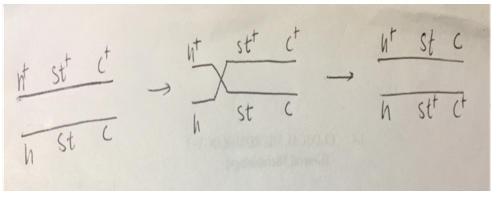
Fig: 2 (b) Crossing over between st and c genes is as follows:
As shown in fig no. 2 (a) and (b), the crossing is between h andst and st and c genes.
The crossing over between genes h and st and between st and c genes results into the formation of various recombination like 4 single crossover, 2 non-recombinants and 2 double cross over.
The table changes according to the order of genes as shown below:
| Phage progeny genotype | Number of plagues | Recombination |
| h+st+c+ | 321 | Non- recombinant |
| h st c | 338 | Non- recombinant |
| h+/stc | 26 | Single cross over |
| h /st+c+ | 30 | Single cross over |
| h+st+/c | 106 | Single cross over |
| h st/ c+ | 110 | Single cross over |
| h+/st/ c+ | 5 | Double cross over |
| h /st+/c | 6 | Double cross over |
| Total | 942 |
The formula used for recombinant frequency is:
The number of recombinant progeny that shows the crossing over in h gene and st gene is as follows:
= h+/st c , h /st+c+ , h+/st/ c+, h /st+/c.
= 26 + 30 + 5+ 6
= 67
Similarly, the recombinant frequency between st and c gene can be found by crossing over between st and c gene.
Total number of recombinant plagues is:
h+st+/c , h st/ c+, h+/st/ c+, h /st+/c
= 106 + 110 + 5 + 6
= 227
Now, the recombinant frequency between st and c gene is obtained as:
As the recombinant frequency is equal to the distance between the genes in map units, so the distance between the h andst gene is 7.1 map units and the distance between st andc gene is 24.1 map units.
c.
To determine:
The coefficient of coincidence and the interference.
Introduction:
The coefficient of coincidence is defined as the ratio of observed double crossover to the number of expected double cross over. Interference is defined as the extent up to which one crossover interferes with additional crossovers.
c.
Explanation of Solution
coefficient of coincidence is determined as:
Similarly, the probability ofrecombination between st and c gene is obtained as:
The total number of double crossovers is as follows:
= number of plagues of h+/st/ c+ and h /st+/c
= 5+6
=11
Number of expected double crossover can be obtained by
Coefficient of coincidence
Interference is determined as :
The recombination frequency obtained is used to determine the coefficient of coincidence and interference.
Want to see more full solutions like this?
Chapter 9 Solutions
Genetics: A Conceptual Approach

- please fill in the empty sports, thank you!arrow_forwardIn one paragraph show how atoms and they're structure are related to the structure of dna and proteins. Talk about what atoms are. what they're made of, why chemical bonding is important to DNA?arrow_forwardWhat are the structure and properties of atoms and chemical bonds (especially how they relate to DNA and proteins).arrow_forward
- The Sentinel Cell: Nature’s Answer to Cancer?arrow_forwardMolecular Biology Question You are working to characterize a novel protein in mice. Analysis shows that high levels of the primary transcript that codes for this protein are found in tissue from the brain, muscle, liver, and pancreas. However, an antibody that recognizes the C-terminal portion of the protein indicates that the protein is present in brain, muscle, and liver, but not in the pancreas. What is the most likely explanation for this result?arrow_forwardMolecular Biology Explain/discuss how “slow stop” and “quick/fast stop” mutants wereused to identify different protein involved in DNA replication in E. coli.arrow_forward
- Molecular Biology Question A gene that codes for a protein was removed from a eukaryotic cell and inserted into a prokaryotic cell. Although the gene was successfully transcribed and translated, it produced a different protein than it produced in the eukaryotic cell. What is the most likely explanation?arrow_forwardMolecular Biology LIST three characteristics of origins of replicationarrow_forwardMolecular Biology Question Please help. Thank you For E coli DNA polymerase III, give the structure and function of the b-clamp sub-complex. Describe how the structure of this sub-complex is important for it’s function.arrow_forward
 Human Anatomy & Physiology (11th Edition)BiologyISBN:9780134580999Author:Elaine N. Marieb, Katja N. HoehnPublisher:PEARSON
 Biology 2eBiologyISBN:9781947172517Author:Matthew Douglas, Jung Choi, Mary Ann ClarkPublisher:OpenStax
 Anatomy & PhysiologyBiologyISBN:9781259398629Author:McKinley, Michael P., O'loughlin, Valerie Dean, Bidle, Theresa StouterPublisher:Mcgraw Hill Education,
 Molecular Biology of the Cell (Sixth Edition)BiologyISBN:9780815344322Author:Bruce Alberts, Alexander D. Johnson, Julian Lewis, David Morgan, Martin Raff, Keith Roberts, Peter WalterPublisher:W. W. Norton & Company
 Laboratory Manual For Human Anatomy & PhysiologyBiologyISBN:9781260159363Author:Martin, Terry R., Prentice-craver, CynthiaPublisher:McGraw-Hill Publishing Co.
 Inquiry Into Life (16th Edition)BiologyISBN:9781260231700Author:Sylvia S. Mader, Michael WindelspechtPublisher:McGraw Hill Education