
Videos
a)
To verify whether there are any outliers in given data.
a)
Explanation of Solution
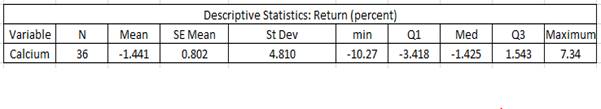
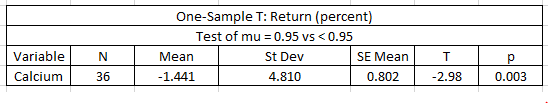
Given:The Minitab output of data of broker’s returns for a random sample of 36 weeks and a significance test to compare the returns with market performance are shown below
Concept used:The boundaries for outliers are shown below
Any values which does not lie between these boundaries are considered as outliers in a data distribution.
Calculation:From the given information
We get Inter
Interpretation:
Here the minimum value is -10.270 and maximum value is 7.340. Hence all values do lie between the boundaries of outliers. Hence there are no outliers in the data.
b)
To interpret the p value from Minitab output.
b)
Explanation of Solution
From the Minitab output the p value is 0.003.
If the average percentage of return is 0.95% per month, then the probability of getting a random sample of 36 weeks with an average returns -1.441 or less is approximately 0.003. It also concludes that the average returns for 36 weeks is less than 0.95% per month.
c)
To verify if the data provide convincing evidence to support the lawyer’s case.
c)
Explanation of Solution
Concept used:The conditions to perform a one sample t testfor µ.The sample has to be randomly selected.
The population should follow a
The sample should be less than 10% of the population.
Calculation:
To test the claim that the average returns per month µ is less than its true value 0.95%.
The null and alternate hypothesis are shown below
The sample of 36 weeks when stock market did well are selected randomly. The population is of large size, so we can approximately assume it to be a normal distribution. There will be more than 360 weeks where stock market did well, so 10% condition is also satisfied.
A one sample t test is run and we get test statistic of
Conclusion:At 5% level of significance there is evidence to conclude that the returns are less than 0.95% per month.
Chapter 9 Solutions
The Practice of Statistics for AP - 4th Edition
Additional Math Textbook Solutions
A First Course in Probability (10th Edition)
Calculus: Early Transcendentals (2nd Edition)
Introductory Statistics
Thinking Mathematically (6th Edition)
Pre-Algebra Student Edition


- 7.1. If X has an exponential distribution with the parameter 0, use the distribution function technique to find the probability density of the random variable Y = ln X. bilaga in dwreatarrow_forward3. Pleasearrow_forwardWhat does the margin of error include? When a margin of error is reported for a survey, it includes a. random sampling error and other practical difficulties like undercoverage and non-response b. random sampling error, but not other practical difficulties like undercoverage and nonresponse c. practical difficulties like undercoverage and nonresponse, but not random smapling error d. none of the above is corretarrow_forward
- solve the question based on hw 1, 1.41arrow_forwardT1.4: Let ẞ(G) be the minimum size of a vertex cover, a(G) be the maximum size of an independent set and m(G) = |E(G)|. (i) Prove that if G is triangle free (no induced K3) then m(G) ≤ a(G)B(G). Hints - The neighborhood of a vertex in a triangle free graph must be independent; all edges have at least one end in a vertex cover. (ii) Show that all graphs of order n ≥ 3 and size m> [n2/4] contain a triangle. Hints - you may need to use either elementary calculus or the arithmetic-geometric mean inequality.arrow_forwardWe consider the one-period model studied in class as an example. Namely, we assumethat the current stock price is S0 = 10. At time T, the stock has either moved up toSt = 12 (with probability p = 0.6) or down towards St = 8 (with probability 1−p = 0.4).We consider a call option on this stock with maturity T and strike price K = 10. Theinterest rate on the money market is zero.As in class, we assume that you, as a customer, are willing to buy the call option on100 shares of stock for $120. The investor, who sold you the option, can adopt one of thefollowing strategies: Strategy 1: (seen in class) Buy 50 shares of stock and borrow $380. Strategy 2: Buy 55 shares of stock and borrow $430. Strategy 3: Buy 60 shares of stock and borrow $480. Strategy 4: Buy 40 shares of stock and borrow $280.(a) For each of strategies 2-4, describe the value of the investor’s portfolio at time 0,and at time T for each possible movement of the stock.(b) For each of strategies 2-4, does the investor have…arrow_forward
- Negate the following compound statement using De Morgans's laws.arrow_forwardNegate the following compound statement using De Morgans's laws.arrow_forwardQuestion 6: Negate the following compound statements, using De Morgan's laws. A) If Alberta was under water entirely then there should be no fossil of mammals.arrow_forward
 MATLAB: An Introduction with ApplicationsStatisticsISBN:9781119256830Author:Amos GilatPublisher:John Wiley & Sons Inc
 Probability and Statistics for Engineering and th...StatisticsISBN:9781305251809Author:Jay L. DevorePublisher:Cengage Learning
 Statistics for The Behavioral Sciences (MindTap C...StatisticsISBN:9781305504912Author:Frederick J Gravetter, Larry B. WallnauPublisher:Cengage Learning
 Elementary Statistics: Picturing the World (7th E...StatisticsISBN:9780134683416Author:Ron Larson, Betsy FarberPublisher:PEARSON
 The Basic Practice of StatisticsStatisticsISBN:9781319042578Author:David S. Moore, William I. Notz, Michael A. FlignerPublisher:W. H. Freeman
 Introduction to the Practice of StatisticsStatisticsISBN:9781319013387Author:David S. Moore, George P. McCabe, Bruce A. CraigPublisher:W. H. Freeman