
Statistics: The Art and Science of Learning from Data (4th Edition)
4th Edition
ISBN: 9780321997838
Author: Alan Agresti, Christine A. Franklin, Bernhard Klingenberg
Publisher: PEARSON
expand_more
expand_more
format_list_bulleted
Videos
Textbook Question
Chapter 9.3, Problem 36PB
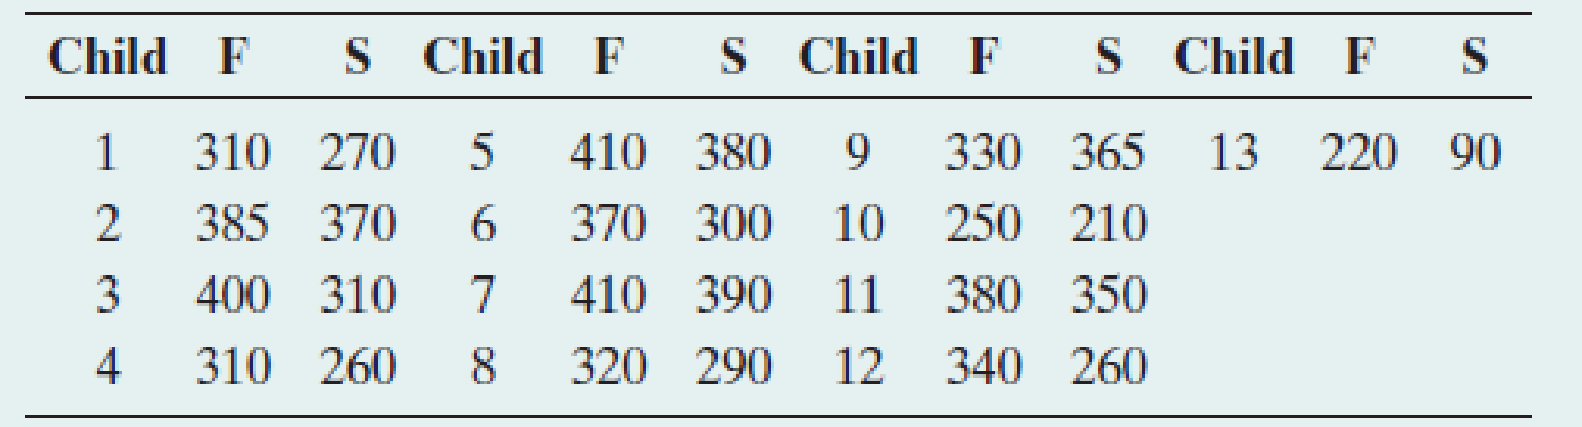
Crossover study A crossover study of 13 children suffering from asthma (Clinical and Experimental Allergy, vol. 20, pp. 429–432, 1990) compared single inhaled doses of formo-terol (F) and salbutamol (S). The outcome measured was the child’s peak expiratory flow (PEF) 8 hours following treatment. The data on PEF follow:
Let µ denote the population
- a. Form the 13 difference scores, for instance 310 − 270 = 40 for child 1 and 330 − 365 = −35 for child 9, always taking F − S. Construct a dot plot or a box plot. Describe the sample data distribution.
- b. Carry out the five steps of the significance test for a mean of the difference scores, using H0: µ = 0 and Ha: µ ≠ 0.
- c. Discuss whether the assumptions seem valid for this example. What is the impact of using a convenience sample?
Expert Solution & Answer
Want to see the full answer?
Check out a sample textbook solution
Students have asked these similar questions
1 No.
2
3
4
Binomial Prob.
X
n
P
Answer
5
6 4
7
8
9
10
12345678
8
3
4
2
2552
10
0.7
0.233
0.3
0.132
7
0.6
0.290
20
0.02
0.053
150
1000
0.15
0.035
8
7
10
0.7
0.383
11
9
3
5
0.3
0.132
12
10
4
7
0.6
0.290
13
Poisson Probability
14
X
lambda
Answer
18 4
19
20
21
22
23 9
15
16
17 3
1234567829
3
2
0.180
2
1.5
0.251
12
10
0.095
5
3
0.101
7
4
0.060
3
2
0.180
2
1.5
0.251
24 10
12
10
0.095
step by step on Microssoft on how to put this in excel and the answers please
Find binomial probability if:
x = 8, n = 10, p = 0.7
x= 3, n=5, p = 0.3
x = 4, n=7, p = 0.6
Quality Control: A factory produces light bulbs with a 2% defect rate. If a random sample of 20 bulbs is tested, what is the probability that exactly 2 bulbs are defective? (hint: p=2% or 0.02; x =2, n=20; use the same logic for the following problems)
Marketing Campaign: A marketing company sends out 1,000 promotional emails. The probability of any email being opened is 0.15. What is the probability that exactly 150 emails will be opened? (hint: total emails or n=1000, x =150)
Customer Satisfaction: A survey shows that 70% of customers are satisfied with a new product. Out of 10 randomly selected customers, what is the probability that at least 8 are satisfied? (hint: One of the keyword in this question is “at least 8”, it is not “exactly 8”, the correct formula for this should be = 1- (binom.dist(7, 10, 0.7,…
Kate, Luke, Mary and Nancy are sharing a cake. The cake had previously been divided into four slices (s1, s2, s3 and s4). What is an example of fair division of the cake
S1
S2
S3
S4
Kate
$4.00
$6.00
$6.00
$4.00
Luke
$5.30
$5.00
$5.25
$5.45
Mary
$4.25
$4.50
$3.50
$3.75
Nancy
$6.00
$4.00
$4.00
$6.00
Chapter 9 Solutions
Statistics: The Art and Science of Learning from Data (4th Edition)
Ch. 9.1 - H0 or Ha? For parts a and b, is the statement a...Ch. 9.1 - H0 or Ha? For each of the following, is the...Ch. 9.1 - Burden of proof For a new pesticide, should the...Ch. 9.1 - Financial aid The average financial aid package...Ch. 9.1 - Low-carbohydrate diet A study plans to have a...Ch. 9.1 - Prob. 6PBCh. 9.1 - Proper hypotheses? Explain what is wrong with each...Ch. 9.1 - Prob. 8PBCh. 9.1 - P-value Indicate whether each of the following...Ch. 9.2 - Psychic A person who claims to be psychic says he...
Ch. 9.2 - Prob. 11PBCh. 9.2 - Get P-value from z For a test of H0: p = 0.50, the...Ch. 9.2 - Get more P-values from z Refer to the previous...Ch. 9.2 - Find test statistic and P-value For a test of H0:...Ch. 9.2 - Dogs and cancer A recent study4 considered whether...Ch. 9.2 - Religion important in your life? Americans ages 18...Ch. 9.2 - Prob. 17PBCh. 9.2 - Prob. 18PBCh. 9.2 - Testing a headache remedy Studies that compare...Ch. 9.2 - Gender bias in selecting managers For a large...Ch. 9.2 - Gender discrimination Refer to the 95% confidence...Ch. 9.2 - Garlic to repel ticks A study (J. Amer. Med....Ch. 9.2 - Exit-poll predictions According to an exit poll of...Ch. 9.2 - Which cola? The 49 students in a class at the...Ch. 9.2 - How to sell a burger A fast-food chain wants to...Ch. 9.2 - A binomial headache A null hypothesis states that...Ch. 9.2 - P-value for small samples Example 4, on whether...Ch. 9.3 - Which t has P-value = 0.05? A t test for a mean...Ch. 9.3 - Practice mechanics of a t test A study has a...Ch. 9.3 - Prob. 30PBCh. 9.3 - Low carbohydrate diet In a recent study,8 272...Ch. 9.3 - Prob. 32PBCh. 9.3 - Facebook friends Many students brag that they have...Ch. 9.3 - Lake pollution An industrial plant claims to...Ch. 9.3 - Weight change for controls A disadvantage of the...Ch. 9.3 - Crossover study A crossover study of 13 children...Ch. 9.3 - Too little or too much wine? Wine-pouring vending...Ch. 9.3 - Prob. 38PBCh. 9.3 - Assumptions important? Refer to the previous...Ch. 9.3 - Anorexia in teenage girls Example 8 described a...Ch. 9.3 - Sensitivity study Ideally, results of a...Ch. 9.3 - Prob. 42PBCh. 9.4 - Dr. Dog In the experiment in Example 4, we got a...Ch. 9.4 - Error probability A significance test about a...Ch. 9.4 - Fracking errors Example 6, in testing H0: p = 0.5...Ch. 9.4 - Prob. 46PBCh. 9.4 - Anorexia decision Refer to the previous exercise....Ch. 9.4 - Prob. 48PBCh. 9.4 - Errors in medicine Consider the test of H0: The...Ch. 9.4 - Prob. 50PBCh. 9.4 - Detecting prostate cancer Refer to the previous...Ch. 9.4 - Prob. 52PBCh. 9.5 - Misleading summaries? Two researchers conduct...Ch. 9.5 - Practical significance A study considers whether...Ch. 9.5 - Prob. 55PBCh. 9.5 - Fishing for significance A marketing study...Ch. 9.5 - Prob. 57PBCh. 9.5 - Prob. 58PBCh. 9.5 - Interpret medical research studies a. An...Ch. 9.6 - Find P(Type II error) A study is designed to test...Ch. 9.6 - Gender bias in selecting managers Exercise 9.20...Ch. 9.6 - Prob. 62PBCh. 9.6 - P(Type II error) large when p close to H0 For...Ch. 9.6 - Prob. 64PBCh. 9.6 - Power for infertility trial Consider Example 13...Ch. 9.6 - Exploring Type II errors Refer to the web app from...Ch. 9 - H0 or Ha? For each of the following hypotheses,...Ch. 9 - Write H0 and Ha For each of the following...Ch. 9 - Prob. 69CPCh. 9 - Free-throw accuracy Consider all cases in which a...Ch. 9 - Brown or Whitman? Californias governor election in...Ch. 9 - Prob. 72CPCh. 9 - Prob. 73CPCh. 9 - Prob. 74CPCh. 9 - Prob. 75CPCh. 9 - Start a hockey team A fraternity at a university...Ch. 9 - Prob. 77CPCh. 9 - Prob. 78CPCh. 9 - Prob. 79CPCh. 9 - Prob. 80CPCh. 9 - Prob. 81CPCh. 9 - Two ideal children? Is the ideal number of...Ch. 9 - Prob. 83CPCh. 9 - Prob. 84CPCh. 9 - Blood pressure When Vincenzo Baranellos blood...Ch. 9 - Increasing blood pressure In the previous...Ch. 9 - Tennis balls in control? When it is operating...Ch. 9 - Prob. 88CPCh. 9 - Prob. 89CPCh. 9 - CI and test Refer to the previous exercise. a. For...Ch. 9 - Prob. 91CPCh. 9 - Religious beliefs statistically significant? A...Ch. 9 - Prob. 93CPCh. 9 - Prob. 94CPCh. 9 - Prob. 95CPCh. 9 - Prob. 96CPCh. 9 - Prob. 98CPCh. 9 - Baseball home team advantage In Major League...Ch. 9 - Prob. 100CPCh. 9 - Prob. 101CPCh. 9 - Prob. 102CPCh. 9 - Prob. 103CPCh. 9 - Prob. 104CPCh. 9 - Prob. 105CPCh. 9 - Prob. 106CPCh. 9 - Prob. 107CPCh. 9 - Prob. 108CPCh. 9 - Significance Explain the difference between...Ch. 9 - More doctors recommend An advertisement by Company...Ch. 9 - Prob. 111CPCh. 9 - Bad P-value interpretations A random sample of...Ch. 9 - Prob. 113CPCh. 9 - Prob. 114CPCh. 9 - Prob. 115CPCh. 9 - Prob. 116CPCh. 9 - Prob. 117CPCh. 9 - Prob. 118CPCh. 9 - Prob. 119CPCh. 9 - Prob. 120CPCh. 9 - Prob. 121CPCh. 9 - True or false A 95% confidence interval for =...Ch. 9 - Prob. 123CPCh. 9 - Prob. 124CPCh. 9 - Prob. 125CPCh. 9 - Prob. 126CPCh. 9 - Prob. 127CPCh. 9 - Prob. 128CP
Knowledge Booster


Learn more about
Need a deep-dive on the concept behind this application? Look no further. Learn more about this topic, statistics and related others by exploring similar questions and additional content below.Similar questions
- Faye cuts the sandwich in two fair shares to her. What is the first half s1arrow_forwardQuestion 2. An American option on a stock has payoff given by F = f(St) when it is exercised at time t. We know that the function f is convex. A person claims that because of convexity, it is optimal to exercise at expiration T. Do you agree with them?arrow_forwardQuestion 4. We consider a CRR model with So == 5 and up and down factors u = 1.03 and d = 0.96. We consider the interest rate r = 4% (over one period). Is this a suitable CRR model? (Explain your answer.)arrow_forward
- Question 3. We want to price a put option with strike price K and expiration T. Two financial advisors estimate the parameters with two different statistical methods: they obtain the same return rate μ, the same volatility σ, but the first advisor has interest r₁ and the second advisor has interest rate r2 (r1>r2). They both use a CRR model with the same number of periods to price the option. Which advisor will get the larger price? (Explain your answer.)arrow_forwardQuestion 5. We consider a put option with strike price K and expiration T. This option is priced using a 1-period CRR model. We consider r > 0, and σ > 0 very large. What is the approximate price of the option? In other words, what is the limit of the price of the option as σ∞. (Briefly justify your answer.)arrow_forwardQuestion 6. You collect daily data for the stock of a company Z over the past 4 months (i.e. 80 days) and calculate the log-returns (yk)/(-1. You want to build a CRR model for the evolution of the stock. The expected value and standard deviation of the log-returns are y = 0.06 and Sy 0.1. The money market interest rate is r = 0.04. Determine the risk-neutral probability of the model.arrow_forward
- Several markets (Japan, Switzerland) introduced negative interest rates on their money market. In this problem, we will consider an annual interest rate r < 0. We consider a stock modeled by an N-period CRR model where each period is 1 year (At = 1) and the up and down factors are u and d. (a) We consider an American put option with strike price K and expiration T. Prove that if <0, the optimal strategy is to wait until expiration T to exercise.arrow_forwardWe consider an N-period CRR model where each period is 1 year (At = 1), the up factor is u = 0.1, the down factor is d = e−0.3 and r = 0. We remind you that in the CRR model, the stock price at time tn is modeled (under P) by Sta = So exp (μtn + σ√AtZn), where (Zn) is a simple symmetric random walk. (a) Find the parameters μ and σ for the CRR model described above. (b) Find P Ste So 55/50 € > 1). StN (c) Find lim P 804-N (d) Determine q. (You can use e- 1 x.) Ste (e) Find Q So (f) Find lim Q 004-N StN Soarrow_forwardIn this problem, we consider a 3-period stock market model with evolution given in Fig. 1 below. Each period corresponds to one year. The interest rate is r = 0%. 16 22 28 12 16 12 8 4 2 time Figure 1: Stock evolution for Problem 1. (a) A colleague notices that in the model above, a movement up-down leads to the same value as a movement down-up. He concludes that the model is a CRR model. Is your colleague correct? (Explain your answer.) (b) We consider a European put with strike price K = 10 and expiration T = 3 years. Find the price of this option at time 0. Provide the replicating portfolio for the first period. (c) In addition to the call above, we also consider a European call with strike price K = 10 and expiration T = 3 years. Which one has the highest price? (It is not necessary to provide the price of the call.) (d) We now assume a yearly interest rate r = 25%. We consider a Bermudan put option with strike price K = 10. It works like a standard put, but you can exercise it…arrow_forward
- In this problem, we consider a 2-period stock market model with evolution given in Fig. 1 below. Each period corresponds to one year (At = 1). The yearly interest rate is r = 1/3 = 33%. This model is a CRR model. 25 15 9 10 6 4 time Figure 1: Stock evolution for Problem 1. (a) Find the values of up and down factors u and d, and the risk-neutral probability q. (b) We consider a European put with strike price K the price of this option at time 0. == 16 and expiration T = 2 years. Find (c) Provide the number of shares of stock that the replicating portfolio contains at each pos- sible position. (d) You find this option available on the market for $2. What do you do? (Short answer.) (e) We consider an American put with strike price K = 16 and expiration T = 2 years. Find the price of this option at time 0 and describe the optimal exercising strategy. (f) We consider an American call with strike price K ○ = 16 and expiration T = 2 years. Find the price of this option at time 0 and describe…arrow_forward2.2, 13.2-13.3) question: 5 point(s) possible ubmit test The accompanying table contains the data for the amounts (in oz) in cans of a certain soda. The cans are labeled to indicate that the contents are 20 oz of soda. Use the sign test and 0.05 significance level to test the claim that cans of this soda are filled so that the median amount is 20 oz. If the median is not 20 oz, are consumers being cheated? Click the icon to view the data. What are the null and alternative hypotheses? OA. Ho: Medi More Info H₁: Medi OC. Ho: Medi H₁: Medi Volume (in ounces) 20.3 20.1 20.4 Find the test stat 20.1 20.5 20.1 20.1 19.9 20.1 Test statistic = 20.2 20.3 20.3 20.1 20.4 20.5 Find the P-value 19.7 20.2 20.4 20.1 20.2 20.2 P-value= (R 19.9 20.1 20.5 20.4 20.1 20.4 Determine the p 20.1 20.3 20.4 20.2 20.3 20.4 Since the P-valu 19.9 20.2 19.9 Print Done 20 oz 20 oz 20 oz 20 oz ce that the consumers are being cheated.arrow_forwardT Teenage obesity (O), and weekly fast-food meals (F), among some selected Mississippi teenagers are: Name Obesity (lbs) # of Fast-foods per week Josh 185 10 Karl 172 8 Terry 168 9 Kamie Andy 204 154 12 6 (a) Compute the variance of Obesity, s²o, and the variance of fast-food meals, s², of this data. [Must show full work]. (b) Compute the Correlation Coefficient between O and F. [Must show full work]. (c) Find the Coefficient of Determination between O and F. [Must show full work]. (d) Obtain the Regression equation of this data. [Must show full work]. (e) Interpret your answers in (b), (c), and (d). (Full explanations required). Edit View Insert Format Tools Tablearrow_forward
arrow_back_ios
SEE MORE QUESTIONS
arrow_forward_ios
Recommended textbooks for you
 Glencoe Algebra 1, Student Edition, 9780079039897...AlgebraISBN:9780079039897Author:CarterPublisher:McGraw Hill
Glencoe Algebra 1, Student Edition, 9780079039897...
Algebra
ISBN:9780079039897
Author:Carter
Publisher:McGraw Hill
Hypothesis Testing using Confidence Interval Approach; Author: BUM2413 Applied Statistics UMP;https://www.youtube.com/watch?v=Hq1l3e9pLyY;License: Standard YouTube License, CC-BY
Hypothesis Testing - Difference of Two Means - Student's -Distribution & Normal Distribution; Author: The Organic Chemistry Tutor;https://www.youtube.com/watch?v=UcZwyzwWU7o;License: Standard Youtube License