a.
To determine:
The order of the three genes on the phage chromosome.
Introduction:
The E.coli is infected by the two strains of phage
a.
Explanation of Solution
Pictorial representation:
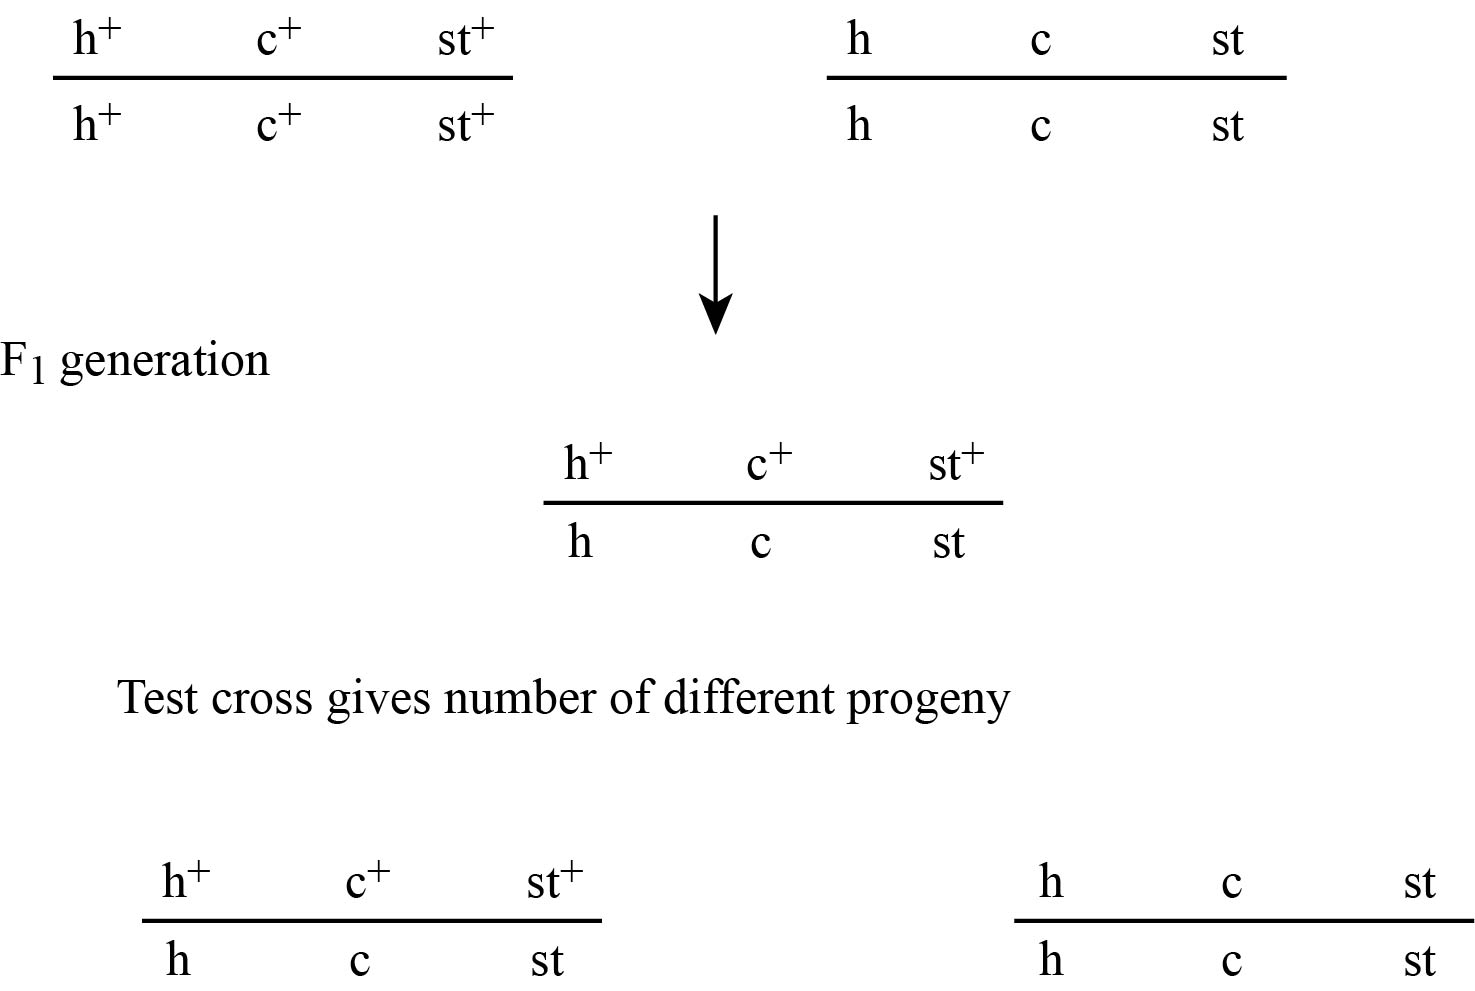
Figure 1(a)
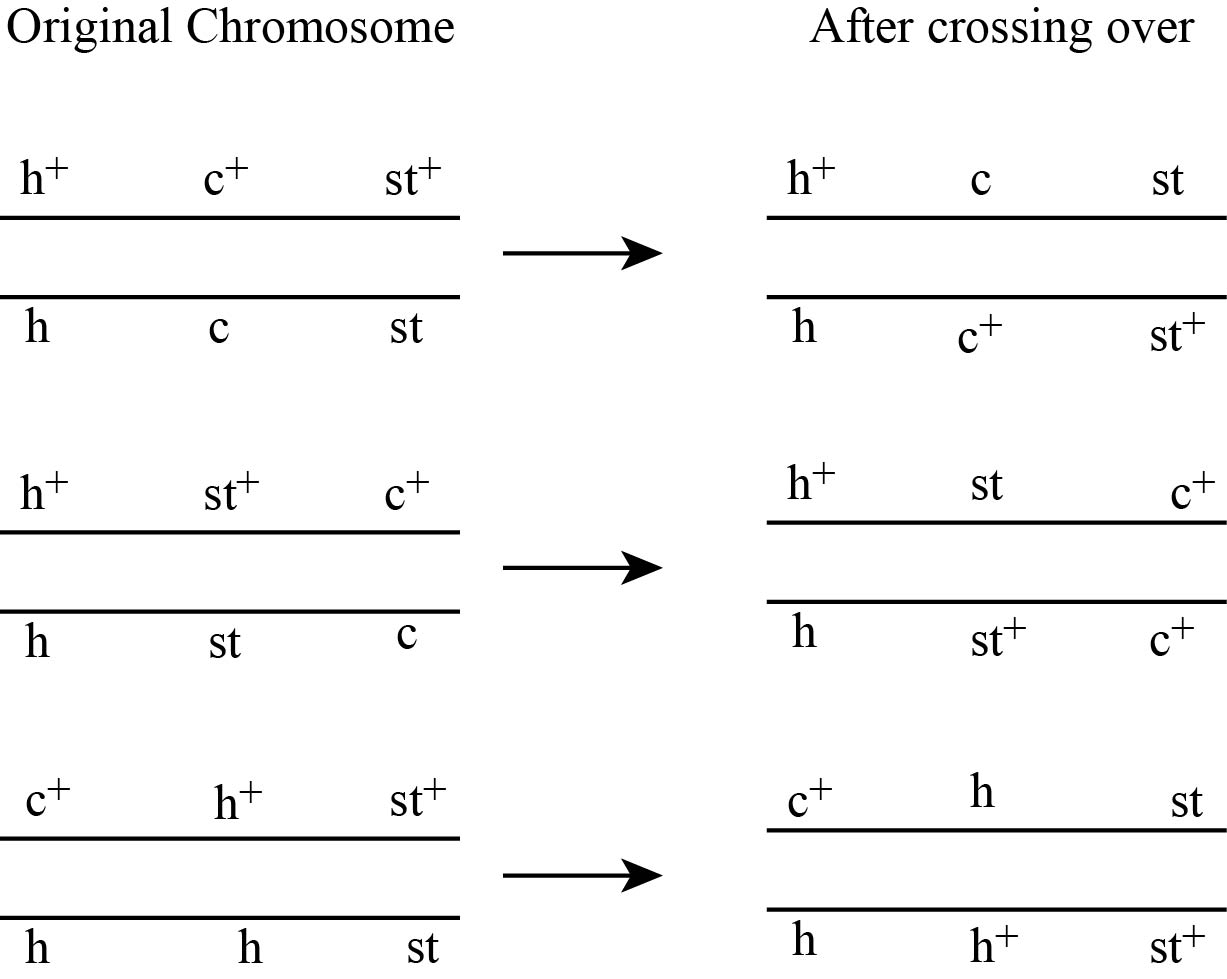
Figure 1(b)
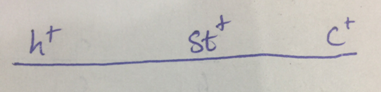
Figure 1(c)
In figure no 1(a), the F1 generation obtained is used to find the order of genes. The possibilities that the genes could be placed in three orders are.
Gene c in the middle and it may be h c st
Gene h in the middle and it may be c hst
Gene st in the middle and it may be h st c
The chromosome which produces same set of alleles which the change in the middle locus is h+ st+ c+ and h stc . In other two chromosomes, two genes change their place. So, here the order of genes is shown in fig no,. 1(c)
b.
To determine:
The map distance between the genes.
Introduction:
The distance between the genes is mapped or measured by crossing over and determing the recombination frequency. The recombination may be singlecross over, double cross over, recombinant or non-recombinant.
b.
Explanation of Solution
Pictorial representation:
Fig 2 (a) Crossing over between the genes h and st is as follows:
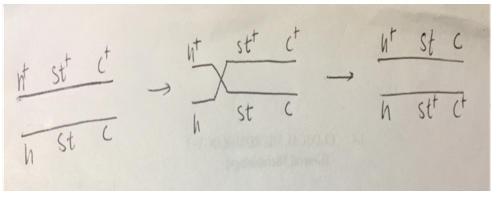
Fig: 2 (b) Crossing over between st and c genes is as follows:
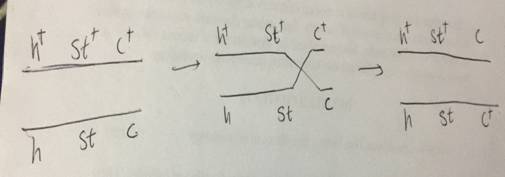
As shown in fig no. 2 (a) and (b), the crossing is between h andst and st and c genes.
The crossing over between genes h and st and between st and c genes results into the formation of various recombination like 4 single crossover, 2 non-recombinants and 2 double cross over.
The table changes according to the order of genes as shown below:
| Phage progeny genotype | Number of plagues | Recombination |
| h+st+c+ | 321 | Non- recombinant |
| h st c | 338 | Non- recombinant |
| h+/stc | 26 | Single cross over |
| h /st+c+ | 30 | Single cross over |
| h+st+/c | 106 | Single cross over |
| h st/ c+ | 110 | Single cross over |
| h+/st/ c+ | 5 | Double cross over |
| h /st+/c | 6 | Double cross over |
| Total | 942 |
The formula used for recombinant frequency is:
The number of recombinant progeny that shows the crossing over in h gene and st gene is as follows:
= h+/st c , h /st+c+ , h+/st/ c+, h /st+/c.
= 26 + 30 + 5+ 6
= 67
Similarly, the recombinant frequency between st and c gene can be found by crossing over between st and c gene.
Total number of recombinant plagues is:
h+st+/c , h st/ c+, h+/st/ c+, h /st+/c
= 106 + 110 + 5 + 6
= 227
Now, the recombinant frequency between st and c gene is obtained as:
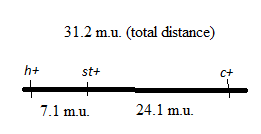
As the recombinant frequency is equal to the distance between the genes in map units, so the distance between the h andst gene is 7.1 map units and the distance between st andc gene is 24.1 map units.
c.
To determine:
The coefficient of coincidence and the interference.
Introduction:
The coefficient of coincidence is defined as the ratio of observed double crossover to the number of expected double cross over. Interference is defined as the extent up to which one crossover interferes with additional crossovers.
c.
Explanation of Solution
coefficient of coincidence is determined as:
Similarly, the probability ofrecombination between st and c gene is obtained as:
The total number of double crossovers is as follows:
= number of plagues of h+/st/ c+ and h /st+/c
= 5+6
=11
Number of expected double crossover can be obtained by
Coefficient of coincidence
Interference is determined as :
The recombination frequency obtained is used to determine the coefficient of coincidence and interference.
Want to see more full solutions like this?
Chapter 9 Solutions
Genetics

- Which of the following is not a DNA binding protein? 1. the lac repressor protein 2. the catabolite activated protein 3. the trp repressor protein 4. the flowering locus C protein 5. the flowering locus D protein 6. GAL4 7. all of the above are DNA binding proteinsarrow_forwardWhat symbolic and cultural behaviors are evident in the archaeological record and associated with Neandertals and anatomically modern humans in Europe beginning around 35,000 yBP (during the Upper Paleolithic)?arrow_forwardDescribe three cranial and postcranial features of Neanderthals skeletons that are likely adaptation to the cold climates of Upper Pleistocene Europe and explain how they are adaptations to a cold climate.arrow_forward
- Biology Questionarrow_forward✓ Details Draw a protein that is embedded in a membrane (a transmembrane protein), label the lipid bilayer and the protein. Identify the areas of the lipid bilayer that are hydrophobic and hydrophilic. Draw a membrane with two transporters: a proton pump transporter that uses ATP to generate a proton gradient, and a second transporter that moves glucose by secondary active transport (cartoon-like is ok). It will be important to show protons moving in the correct direction, and that the transporter that is powered by secondary active transport is logically related to the proton pump.arrow_forwarddrawing chemical structure of ATP. please draw in and label whats asked. Thank you.arrow_forward
- Outline the negative feedback loop that allows us to maintain a healthy water concentration in our blood. You may use diagram if you wisharrow_forwardGive examples of fat soluble and non-fat soluble hormonesarrow_forwardJust click view full document and register so you can see the whole document. how do i access this. following from the previous question; https://www.bartleby.com/questions-and-answers/hi-hi-with-this-unit-assessment-psy4406-tp4-report-assessment-material-case-stydu-ms-alecia-moore.-o/5e09906a-5101-4297-a8f7-49449b0bb5a7. on Google this image comes up and i have signed/ payed for the service and unable to access the full document. are you able to copy and past to this response. please see the screenshot from google page. unfortunality its not allowing me attch the image can you please show me the mathmetic calculation/ workout for the reult sectionarrow_forward
 Human Anatomy & Physiology (11th Edition)BiologyISBN:9780134580999Author:Elaine N. Marieb, Katja N. HoehnPublisher:PEARSON
 Biology 2eBiologyISBN:9781947172517Author:Matthew Douglas, Jung Choi, Mary Ann ClarkPublisher:OpenStax
 Anatomy & PhysiologyBiologyISBN:9781259398629Author:McKinley, Michael P., O'loughlin, Valerie Dean, Bidle, Theresa StouterPublisher:Mcgraw Hill Education,
 Molecular Biology of the Cell (Sixth Edition)BiologyISBN:9780815344322Author:Bruce Alberts, Alexander D. Johnson, Julian Lewis, David Morgan, Martin Raff, Keith Roberts, Peter WalterPublisher:W. W. Norton & Company
 Laboratory Manual For Human Anatomy & PhysiologyBiologyISBN:9781260159363Author:Martin, Terry R., Prentice-craver, CynthiaPublisher:McGraw-Hill Publishing Co.
 Inquiry Into Life (16th Edition)BiologyISBN:9781260231700Author:Sylvia S. Mader, Michael WindelspechtPublisher:McGraw Hill Education