
Concept explainers
Videos
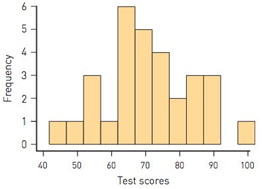
How different are they? (S) The following histogram shows the exam scores for 30 students in a freshman accounting class. Estimate the mean of these scores. Is the standard deviation of these scores likely to be closer to 12 or to 25?
Want to see the full answer?
Check out a sample textbook solution
Chapter 9 Solutions
The Heart of Mathematics: An Invitation to Effective Thinking, WileyPLUS NextGen Card with Loose-leaf Set Single Semester: An Invitation to Effective Thinking (Key Curriculum Press)
Additional Math Textbook Solutions
Calculus: Early Transcendentals (2nd Edition)
Elementary Statistics Using The Ti-83/84 Plus Calculator, Books A La Carte Edition (5th Edition)
Basic Business Statistics, Student Value Edition
Elementary and Intermediate Algebra: Concepts and Applications (7th Edition)
A First Course in Probability (10th Edition)
Algebra and Trigonometry (6th Edition)


- Find the area of the figure. A = 4 m 11 m 13 m 5 marrow_forwardFind the exact values of sin(2u), cos(2u), and tan(2u) given 2 COS u where д < u < π. 2arrow_forward(1) Let R be a field of real numbers and X=R³, X is a vector space over R, let M={(a,b,c)/ a,b,cE R,a+b=3-c}, show that whether M is a hyperplane of X or not (not by definition). متکاری Xn-XKE 11Xn- Xmit (2) Show that every converge sequence in a normed space is Cauchy sequence but the converse need not to be true. EK 2x7 (3) Write the definition of continuous map between two normed spaces and write with prove the equivalent statement to definition. (4) Let be a subset of a normed space X over a field F, show that A is bounded set iff for any sequence in A and any sequence in F converge to zero the sequence converge to zero in F. އarrow_forward
 Big Ideas Math A Bridge To Success Algebra 1: Stu...AlgebraISBN:9781680331141Author:HOUGHTON MIFFLIN HARCOURTPublisher:Houghton Mifflin Harcourt
 Glencoe Algebra 1, Student Edition, 9780079039897...AlgebraISBN:9780079039897Author:CarterPublisher:McGraw Hill
 Holt Mcdougal Larson Pre-algebra: Student Edition...AlgebraISBN:9780547587776Author:HOLT MCDOUGALPublisher:HOLT MCDOUGAL