
Concept explainers
Videos
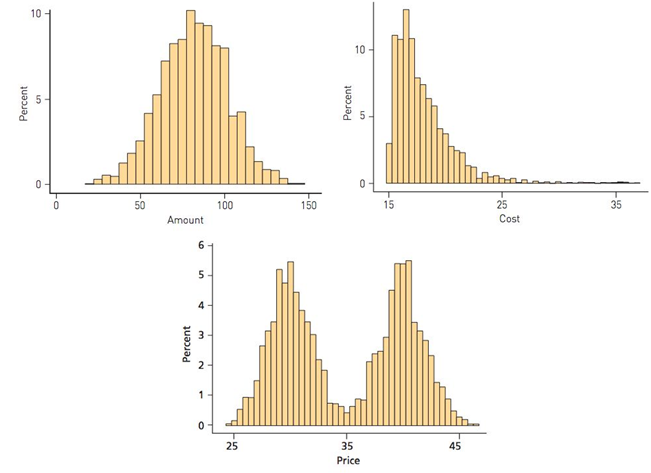
What’s normal? The histograms of three data sets are given below. Classify each data set as having a
Want to see the full answer?
Check out a sample textbook solution
Chapter 9 Solutions
The Heart of Mathematics: An Invitation to Effective Thinking, WileyPLUS NextGen Card with Loose-leaf Set Single Semester: An Invitation to Effective Thinking (Key Curriculum Press)
Additional Math Textbook Solutions
Elementary Statistics: Picturing the World (7th Edition)
A First Course in Probability (10th Edition)
College Algebra with Modeling & Visualization (5th Edition)
A Problem Solving Approach To Mathematics For Elementary School Teachers (13th Edition)
Introductory Statistics
Probability And Statistical Inference (10th Edition)


- A factorization A = PDP 1 is not unique. For A= 7 2 -4 1 1 1 5 0 2 1 one factorization is P = D= and P-1 30 = Use this information with D₁ = to find a matrix P₁ such that - -1 -2 0 3 1 - - 1 05 A-P,D,P P1 (Type an integer or simplified fraction for each matrix element.)arrow_forwardMatrix A is factored in the form PDP 1. Use the Diagonalization Theorem to find the eigenvalues of A and a basis for each eigenspace. 30 -1 - 1 0 -1 400 0 0 1 A= 3 4 3 0 1 3 040 3 1 3 0 0 4 1 0 0 003 -1 0 -1 Select the correct choice below and fill in the answer boxes to complete your choice. (Use a comma to separate vectors as needed.) A basis for the corresponding eigenspace is { A. There is one distinct eigenvalue, λ = B. In ascending order, the two distinct eigenvalues are λ₁ ... = and 2 = Bases for the corresponding eigenspaces are { and ( ), respectively. C. In ascending order, the three distinct eigenvalues are λ₁ = = 12/2 = and 3 = Bases for the corresponding eigenspaces are {}, }, and { respectively.arrow_forwardN Page 0.6. 0.4. 0.2- -0.2- -0.4- -6.6 -5 W 10arrow_forward
- Diagonalize the following matrix, if possible. 8 0 6 - 8 Select the correct choice below and, if necessary, fill in the answer box to complete your choice. 8 0 OA. For P= D= 0 3 6 0 B. For P = D= 0 -6 8 0 C. For P = D= 0 - 8 D. The matrix cannot be diagonalized.arrow_forwardCalculus lll May I please have the solutions for the following exercises? Thank youarrow_forwardCalculus lll May I please have the solution for the following question? Thank youarrow_forward
- No chatgpt pls will upvotearrow_forwardnot use ai pleasearrow_forward4 In the integral dxf1dy (7)², make the change of variables x = ½(r− s), y = ½(r + s), and evaluate the integral. Hint: Find the limits on r and s by sketching the area of integration in the (x, y) plane along with the r and s axes, and then show that the same area can be covered by s from 0 to r and r from 0 to 1.arrow_forward
 Glencoe Algebra 1, Student Edition, 9780079039897...AlgebraISBN:9780079039897Author:CarterPublisher:McGraw Hill
 Big Ideas Math A Bridge To Success Algebra 1: Stu...AlgebraISBN:9781680331141Author:HOUGHTON MIFFLIN HARCOURTPublisher:Houghton Mifflin Harcourt
 Holt Mcdougal Larson Pre-algebra: Student Edition...AlgebraISBN:9780547587776Author:HOLT MCDOUGALPublisher:HOLT MCDOUGAL