In Exercises 5–20, assume that the two samples are independent simple random samples selected from
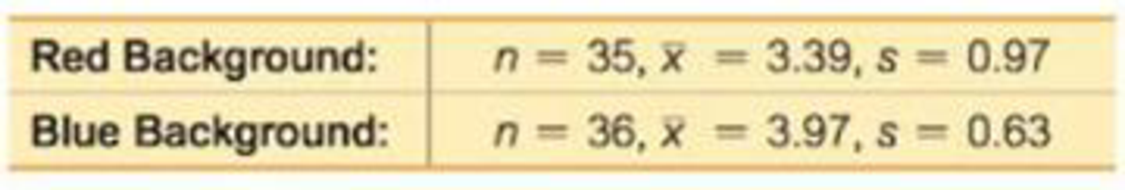
7. Color and Creativity Researchers from the University of British Columbia conducted trials to investigate the effects of color on creativity. Subjects with a red background were asked to think of creative uses for a brick; other subjects with a blue background were given the same task. Responses were scored by a panel of judges and results from scores of creativity are given below. Higher scores correspond to more creativity. The researchers make the claim that “blue enhances performance on a creative task.”
a. Use a 0.01 significance level to test the claim that blue enhances performance on a creative task.
b. Construct the confidence interval appropriate for the hypothesis test in part (a). What is it about the confidence interval that causes us to reach the same conclusion from part (a)?
Want to see the full answer?
Check out a sample textbook solutionChapter 9 Solutions
ESSENTIALS OF STATISTICS 6TH ED W/MYSTA
Additional Math Textbook Solutions
Developmental Mathematics (9th Edition)
Introductory Statistics
An Introduction to Mathematical Statistics and Its Applications (6th Edition)
Stats: Modeling the World Nasta Edition Grades 9-12
Elementary Statistics Using The Ti-83/84 Plus Calculator, Books A La Carte Edition (5th Edition)
- In Exercises 5–20, assume that the two samples are independent simple random samples selected from normally distributed populations, and do not assume that the population standard deviations are equal. (Note: Answers in Appendix D include technology answers based on Formula 9-1 along with “Table” answers based on Table A-3 with df equal to the smaller of n1 − 1 and n2 − 1.) IQ and Lead Exposure Data Set 7 “IQ and Lead” in Appendix B lists full IQ scores for a random sample of subjects with low lead levels in their blood and another random sample of subjects with high lead levels in their blood. The statistics are summarized below. a. Use a 0.05 significance level to test the claim that the mean IQ score of people with low blood lead levels is higher than the mean IQ score of people with high blood lead levels. b. Construct a confidence interval appropriate for the hypothesis test in part (a). c. Does exposure to lead appear to have an effect on IQ scores?arrow_forwardExample 10.9) Assume that the standard deviation o is 300 and n is 25. Calculate the standard error of the sample mean.arrow_forwardP -Values. In Exercises 17–20, do the following: a. Identify the hypothesis test as being two-tailed, left-tailed, or right-tailed. b. Find the p -value. (See Figure 8-3 on page 364.) c. Using a significance level of α = 0.05, should we reject H0 or should we fail to reject H0? The test statistic of z = −2.50 is obtained when testing the claim that p < 0.75.arrow_forward
- A random sample of n1 = 10 regions in New England gave the following violent crime rates (per million population). x1: New England Crime Rate 3.2 3.1 4.0 3.2 3.3 4.1 1.8 4.8 2.9 3.1 Another random sample of n2 = 12 regions in the Rocky Mountain states gave the following violent crime rates (per million population). x2: Rocky Mountain Crime Rate 3.7 4.1 4.5 5.1 3.3 4.8 3.5 2.4 3.1 3.5 5.2 2.8 Assume that the crime rate distribution is approximately normal in both regions. Note: If a two-sample t-test is appropriate, for degrees of freedom d.f. not in the Student's t table, use the closest d.f. that is smaller. In some situations, this choice of d.f. may increase the P-value by a small amount and therefore produce a slightly more "conservative" answer.Use a calculator to calculate x1, s1, x2, and s2. (Round your answers to two decimal places.) x1 = s1 = x2 = s2 = (a) Do the data indicate that the violent crime rate in the Rocky Mountain…arrow_forwardIn Exercises 9–12, refer to the sample data from the given exercises in Section 13–2 on page 611. Use the Wilcoxon signed-ranks test for the claim about the median of a population. Exercise 13 “Earthquake Magnitudes”arrow_forward(iii) Find (or estimate) the P-value. OP-value > 0.250 O 0.125 < P-value < 0.250 O 0.050 < P-value < 0.125 O 0.025 < P-value < 0.050 O 0.005< P-value < 0.025 OP-value < 0.005 Sketch the sampling distribution and show the area corresponding to the P-value. O -4 -2 0 2 2 M 2 DO Q -2 -2 (iv) Based on your answers in parts (a) to (c), will you reject or fail to reject the null hypothesis? Are the data statistically significant at level a? O At the a= 0.01 level, we reject the null hypothesis and conclude the data are not statistically significant. O At the a= 0.01 level, we fail to reject the null hypothesis and conclude the data are not statistically significant. O At the a= 0.01 level, we fail to reject the null hypothesis and conclude the data are statistically significant. O At the a= 0.01 level, we reject the null hypothesis and conclude the data are statistically significant. (v) Interpret your conclusion in the context of the application. O Fail to reject the null hypothesis, there…arrow_forward
- A random sample of n1 = 10 regions in New England gave the following violent crime rates (per million population). x1: New England Crime Rate 3.3 3.9 4.2 4.1 3.3 4.1 1.8 4.8 2.9 3.1 Another random sample of n2 = 12 regions in the Rocky Mountain states gave the following violent crime rates (per million population). x2: Rocky Mountain Crime Rate 3.7 4.1 4.7 5.5 3.3 4.8 3.5 2.4 3.1 3.5 5.2 2.8 Assume that the crime rate distribution is approximately normal in both regions. Do the data indicate that the violent crime rate in the Rocky Mountain region is higher than in New England? Use α = 0.01. Solve the problem using both the traditional method and the P-value method. (Test the difference μ1 − μ2. Round the test statistic and critical value to three decimal places.) test statistic critical valuearrow_forwardA random sample of n1 = 10 regions in New England gave the following violent crime rates (per million population). x1: New England Crime Rate 3.3 3.9 4.2 4.1 3.3 4.1 1.8 4.8 2.9 3.1 Another random sample of n2 = 12 regions in the Rocky Mountain states gave the following violent crime rates (per million population). x2: Rocky Mountain Crime Rate 3.7 4.1 4.7 5.5 3.3 4.8 3.5 2.4 3.1 3.5 5.2 2.8 Assume that the crime rate distribution is approximately normal in both regions. Do the data indicate that the violent crime rate in the Rocky Mountain region is higher than in New England? Use ? = 0.01. Solve the problem using both the traditional method and the P-value method. (Test the difference ?1 − ?2. Round the test statistic and critical value to three decimal places.) test statistic critical value Find (or estimate) the P-value. P-value > 0.2500.125 < P-value < 0.250 0.050 < P-value < 0.1250.025 < P-value < 0.0500.005 <…arrow_forwardA random sample of n1 = 10 regions in New England gave the following violent crime rates (per million population). x1: New England Crime Rate 3.3 3.9 4.2 4.1 3.3 4.1 1.8 4.8 2.9 3.1 Another random sample of n2 = 12 regions in the Rocky Mountain states gave the following violent crime rates (per million population). x2: Rocky Mountain Crime Rate 3.7 4.1 4.7 5.5 3.3 4.8 3.5 2.4 3.1 3.5 5.2 2.8 Assume that the crime rate distribution is approximately normal in both regions. Do the data indicate that the violent crime rate in the Rocky Mountain region is higher than in New England? Use ? = 0.01. Solve the problem using both the traditional method and the P-value method. (Test the difference ?1 − ?2. Round the test statistic and critical value to three decimal places.) test statistic critical value Find (or estimate) the P-value. P-value > 0.250 0.125 < P-value < 0.250 0.050 < P-value < 0.125 0.025 < P-value < 0.050 0.005 <…arrow_forward
- A random sample of n1 = 10 regions in New England gave the following violent crime rates (per million population). x1: New England Crime Rate 3.3 3.7 4.2 3.9 3.3 4.1 1.8 4.8 2.9 3.1 Another random sample of n2 = 12 regions in the Rocky Mountain states gave the following violent crime rates (per million population). x2: Rocky Mountain Crime Rate 3.5 4.1 4.7 5.5 3.3 4.8 3.5 2.4 3.1 3.5 5.2 2.8 Assume that the crime rate distribution is approximately normal in both regions. Do the data indicate that the violent crime rate in the Rocky Mountain region is higher than in New England? Use ? = 0.01. Solve the problem using both the traditional method and the P-value method. (Test the difference ?1 − ?2. Round the test statistic and critical value to three decimal places.) test statistic critical value Find (or estimate) the P-value. A. P-value > 0.250 B. 0.125 < P-value < 0.250 C. 0.050 < P-value < 0.125 D. 0.025 < P-value <…arrow_forwardA random sample of n1 = 10 regions in New England gave the following violent crime rates (per million population). x1: New England Crime Rate 3.5 3.9 4.2 4.1 3.3 4.1 1.8 4.8 2.9 3.1 Another random sample of n2 = 12 regions in the Rocky Mountain states gave the following violent crime rates (per million population). x2: Rocky Mountain Crime Rate 3.7 4.1 4.7 5.5 3.3 4.8 3.5 2.4 3.1 3.5 5.2 2.8 Assume that the crime rate distribution is approximately normal in both regions. (a) Use a calculator to calculate x1, s1, x2, and s2. (Round your answers to four decimal places.) x1=s1=x2=s2= What is the value of the sample test statistic? (Test the difference μ1 − μ2. Round your answer to three decimal places.)arrow_forwardA random sample of n1 = 10 regions in New England gave the following violent crime rates (per million population). x1: New England Crime Rate 3.3 3.7 4.0 4.1 3.3 4.1 1.8 4.8 2.9 3.1 Another random sample of n2 = 12 regions in the Rocky Mountain states gave the following violent crime rates (per million population). x2: Rocky Mountain Crime Rate 3.5 4.3 4.5 5.3 3.3 4.8 3.5 2.4 3.1 3.5 5.2 2.8 Assume that the crime rate distribution is approximately normal in both regions. Do the data indicate that the violent crime rate in the Rocky Mountain region is higher than in New England? Use α = 0.01. Solve the problem using both the traditional method and the P-value method. (Test the difference μ1 − μ2. Round the test statistic and critical value to three decimal places.) test statistic critical value REM (rapid eye movement) sleep is sleep during which most dreams occur. Each night a person has both REM and non-REM sleep. However, it is thought that…arrow_forward
- Holt Mcdougal Larson Pre-algebra: Student Edition...AlgebraISBN:9780547587776Author:HOLT MCDOUGALPublisher:HOLT MCDOUGALGlencoe Algebra 1, Student Edition, 9780079039897...AlgebraISBN:9780079039897Author:CarterPublisher:McGraw Hill