
(a)
Interpretation:
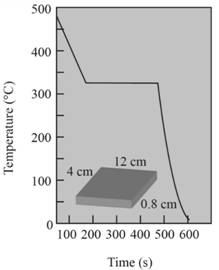
Pouring temperature in the cooling curve needs to be determined.
Concept Introduction:
The cooling curve represents a changein temperature as a function of time.
Cooling curves are of two types of metal- for metal with no inoculation and for metal with inoculation.
Cooling curve represents different temperatures.
Answer to Problem 9.62P
Pouring temperature is
Explanation of Solution
Pouring temperature is the temperature of the liquid at which it is added in the mold.
Hence from the graph shown, temperature is
(b)
Interpretation:
The solidification temperature of the metal in cooling curves needs to be determined
Concept Introduction:
Solidification is a process of forming crystal structure from the molten metal during cooling.
The temperature at which molten metal starts forming crystal is solidification temperature.
Answer to Problem 9.62P
Solidification temperature of metal is
Explanation of Solution
Solidification temperature at which the solidification starts.Hence from the graph, the solidification temperature is
Thus,
(c)
Interpretation:
The superheat temperature of the metal needs to be determined.
Concept Introduction:
Difference between pouring temperature and freezing temperature is known as superheating.
Pouring temperature is the temperature at which metal is introduced in a casting.
Freezing temperature is the temperature at which metal solidifies.
Answer to Problem 9.62P
Superheat temperature is
Explanation of Solution
Superheat is a temperature between pouring temperature and freezing temperature.
Pouring temperature,
Freezing temperature,
(d)
Interpretation:
The cooling rate at the starting of solidification needs to be determined.
Concept Introduction:
Cooling curves are of two types of metal- for metal with no inoculation and for metal with inoculation.
Cooling curve represents different temperatures.
The cooling curve shows the different regions according to the change in temperature at a specific time.
Answer to Problem 9.62P
Cooling rate of metal is
Explanation of Solution
The cooling rate is the rate of change in temperature with respect to time.
According to the graph,the slope of the curve from pouring temperature to freezing temperature shows the rate of cooling.
It is denoted by
Cooling rate
(e)
Interpretation:
The total solidification time needs to be determined.
Concept Introduction:
Solidification is a process of forming crystal structure from molten metal during cooling. The time required to form crystal structure from the molten metal is solidification time.
Answer to Problem 9.62P
Total solidification time of metal is
Explanation of Solution
The time required to remove the specific heat and the latent heat of fusion during cooling of metal is total solidification time.It is the time between the pouring of metal to the completion of solidification.
From the graph,
(f)
Interpretation:
The local solidification time of metal needs to be determined.
Concept Introduction:
Solidification is a process of forming crystal structure from molten metal during cooling. The time required to form crystal structure from molten metal is called solidification time.
Answer to Problem 9.62P
Local solidification time of metal is 340 sec.
Explanation of Solution
The time required to remove the latent heat of fusion at a specific casting location is local solidification time.It is the time between the start of solidification and the end of solidification.
Hence from the graph,
(g)
Interpretation:
The undercooling in the cooling curve needs to be determined.
Concept Introduction:
There are mainly two types of the cooling curve, when metal is well inoculated and when metal is not well inoculated.
Answer to Problem 9.62P
There is no undercooling in the cooling curve.
Explanation of Solution
Liquids don't have nucleating assent.Homogeneous nucleation takes place in B-C region.For cooling curve when the metal is well inoculated, undercooling is not necessary.Solidification starts at melting temperature.
(h)
Interpretation:
The identity of metal needs to be stated.
Concept Introduction:
Cooling curves are of two types of metal- for metal with no inoculation and for metal with inoculation.
Cooling curve represents different temperatures.The cooling curve represents a change in temperature as a function of time.
Answer to Problem 9.62P
Probably the metal should be cadmium.
Explanation of Solution
Given the cooling curve is for metal having well inoculation.For this metal, solidification starts at melting temperature.Solidification of the temperature of this metal is
Hence the probable metal should be cadmium.
(i)
Interpretation:
Mold constant of metal needs to be determined.
Concept Introduction:
As per Chvorinov's rule, solidification time is directly proportional to the square of volume- area ratio of the cast metal.
Here,
Answer to Problem 9.62P
Mold constant is
Explanation of Solution
As per Chvorinov's rule,
Volume of casting can be calculated as follows:
Area of casting can be calculated as follows:
Thus,
Want to see more full solutions like this?
Chapter 9 Solutions
Essentials Of Materials Science And Engineering, Si Edition

- Calculate the BMs (bending moments) at all the joints of the beam shown in Fig.1 using the moment distribution method. The beam is subjected to an UDL of w=65m. L=4.5m L1= 1.8m. Assume the support at C is pinned, and A and B are roller supports. E = 200 GPa, I = 250x106 mm4.arrow_forward||| = 1% 11. LTE2 Voi) Vol) 1. LTE1 SEARCH 8 VYT bartleby.com/dashboard ASK √x MATH SOLV affected resale value at year 5, would that affect perceived value-in-use? How exactly? There is an error in submission of question Check it out! See if this is the solution you're looking for VIEW FULL SOLUTION Not what you're looking for? Keep submitting your original question SUBMIT QUESTIONarrow_forwardNeed help with this in python!arrow_forward
- . The average soil weights for a clay are the following: 2,050 pounds in Loose CY, 2,675pounds in Bank CY, and 2,835 pounds in Compacted CY What is the swell percentage for theclay?arrow_forwardA traffic count taken between 7:00 a.m. and 2:00 p.m. on a rural highway found the following hourly volumes. Time 7:00-8:00 a.m. Hourly volume 332 8:00-9:00 a.m. 311 9:00-10:00 a.m. 263 10:00-11:00 a.m. 273 11:00 a.m.-12:00 p.m. 289 12:00-1:00 p.m. 1:00-2:00 p.m. 286 265 If these data were collected on a Tuesday in February, estimate the AADT (in veh/day) on this section of highway. Assume that the expansion factors given in this table, this table, and this table apply. veh/dayarrow_forwardA project schedule has been updated. The activity placement of spread footing concretewas originally scheduled to begin as early as day 10. The activity duration is 4 days. The actualstart day was day 12. The original schedule had a calculated total float of 7 days for this activity.The recalculated total float for the activity, when updated, would bearrow_forward
- Need help with this in python!arrow_forwardIn preparation for a public hearing, an engineer needs to estimate the travel time savings for a proposed highway bypass of a small city in a rural area. The existing highway goes through the downtown area for 4.1 miles between the points where the bypass will connect. (a) If the engineer anticipates a standard deviation of 7 mi/h and would like a 95% confidence of estimating the mean speed within ±4 mi/h, how many runs should a travel time study include? (Enter the minimum number of runs that achieves a 95% confidence level.) runs (b) If the engineer measures an average speed of 34.9 mi/h through the town and the bypass is expected to operate at speeds of 65 mi/h over a distance of 6.2 miles, what is the expected travel time saving (in minutes) per vehicle? minutes Need Help? Read It Watch Itarrow_forwardHelp! How do I turn the flowchart that searches for a name in an array of names into structured and spaced pseudocode?arrow_forward
- Databasearrow_forwardA Si step junction maintained at room temperature under equilibrium conditions has a p-side doping of NA 2X10¹⁵/cm³ and an n-side doping of ND=1015/cm³. Compare a) Vbi b) Xp, Xn, and W c) ɛ at x=0 d) V at x=0 Make sketches that are roughly to scale of the charge density, electric field, and electrostatic potential as a function of position.arrow_forwardfollow the instructions and make sure to right the complete solutionarrow_forward
 MATLAB: An Introduction with ApplicationsEngineeringISBN:9781119256830Author:Amos GilatPublisher:John Wiley & Sons Inc
 Essentials Of Materials Science And EngineeringEngineeringISBN:9781337385497Author:WRIGHT, Wendelin J.Publisher:Cengage,
 Industrial Motor ControlEngineeringISBN:9781133691808Author:Stephen HermanPublisher:Cengage Learning
 Basics Of Engineering EconomyEngineeringISBN:9780073376356Author:Leland Blank, Anthony TarquinPublisher:MCGRAW-HILL HIGHER EDUCATION
 Structural Steel Design (6th Edition)EngineeringISBN:9780134589657Author:Jack C. McCormac, Stephen F. CsernakPublisher:PEARSON
 Fundamentals of Materials Science and Engineering...EngineeringISBN:9781119175483Author:William D. Callister Jr., David G. RethwischPublisher:WILEY