Survey of Accounting (Accounting I)
8th Edition
ISBN: 9781337517386
Author: WARREN
Publisher: Cengage
expand_more
expand_more
format_list_bulleted
Textbook Question
Chapter 9, Problem 9.4.12P
Twenty metrics of liquidity, solvency, and profitability
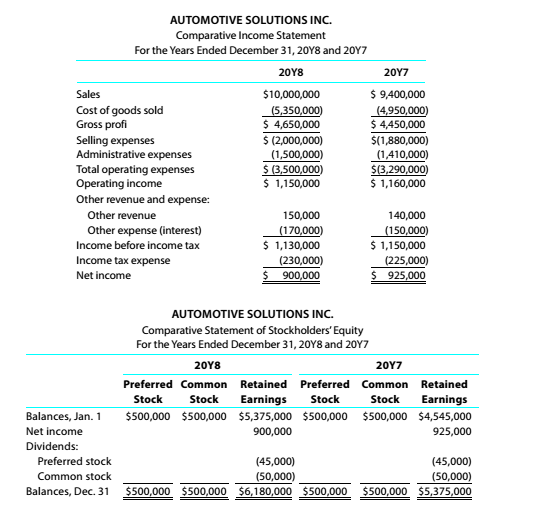
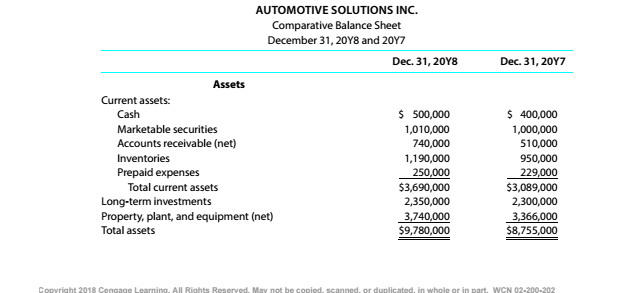
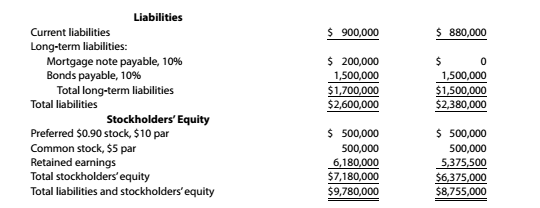
The comparative financial statements of Automotive Solutions Inc. are as follows. The market price of Automotive Solutions Inc. common stock was $119.70 on December 31, 20Y8


Instuctins
Times preferred earned
Expert Solution & Answer
Want to see the full answer?
Check out a sample textbook solution
Students have asked these similar questions
Hogan Industries had the following inventory transactions occur during
2017:
Units
Cost/unit
Feb. 1, 2017 Purchase
95
$ 40
Mar. 14, 2017 Purchase
164
$ 41
May 1, 2017 Purchase
116
$ 43
The company sold 269 units at $55 each and has a tax rate of 30%.
Assuming that a periodic inventory system is used, what is the
company's gross profit using FIFO? (rounded to whole dollars)
A. $10954
B. $3841
C. $3534
D. $11261
Quick answer of this accounting questions
Gross profit is equal to:
A. sales less cost of merchandise sold.
B. sales plus cost of merchandise sold.
C. sales less selling expenses.
D. sales plus selling expenses.
Chapter 9 Solutions
Survey of Accounting (Accounting I)
Ch. 9 - What type of analysis is indicated by the...Ch. 9 - Which of the following measures indicates the...Ch. 9 - Prob. 3SEQCh. 9 - Prob. 4SEQCh. 9 - Prob. 5SEQCh. 9 - That is the difference between horizontal and...Ch. 9 - Prob. 2CDQCh. 9 - Prob. 3CDQCh. 9 - Prob. 4CDQCh. 9 - How would the current and quick ratios of a...
Ch. 9 - For Belzcr Corporation, the working capital at the...Ch. 9 - Prob. 7CDQCh. 9 - Prob. 8CDQCh. 9 - a. Why is it advantageous to have a high inventory...Ch. 9 - Prob. 10CDQCh. 9 - Prob. 11CDQCh. 9 - Prob. 12CDQCh. 9 - Prob. 13CDQCh. 9 - Prob. 14CDQCh. 9 - Prob. 15CDQCh. 9 - Favorable business conditions may bring about...Ch. 9 - Prob. 17CDQCh. 9 - Prob. 9.1ECh. 9 - Vertical analysis of income statement The...Ch. 9 - Common-sized income statement Revenue and expense...Ch. 9 - Prob. 9.4ECh. 9 - Prob. 9.5ECh. 9 - Prob. 9.6ECh. 9 - Prob. 9.7ECh. 9 - Current position analysis The bond indenture for...Ch. 9 - Accounts receivable analysis The following data...Ch. 9 - Prob. 9.10ECh. 9 - Inventory analysis The following data were...Ch. 9 - Inventory analysis Costco Wholesale Corporation...Ch. 9 - Ratio of liabilities to stockholders' equity and...Ch. 9 - Prob. 9.14ECh. 9 - Debt ratio, ratio of liabilities to stockholders'...Ch. 9 - Prob. 9.16ECh. 9 - Profitability metrics The following selected data...Ch. 9 - Profitability metrics Macy's, Inc. (M). sells...Ch. 9 - Seven metrics The following data were taken from...Ch. 9 - Prob. 9.20ECh. 9 - Prob. 9.21ECh. 9 - Prob. 9.22ECh. 9 - Unusual income statement items Assume that the...Ch. 9 - Horizontal analysis for income statement For 20Y3....Ch. 9 - Horizontal analysis for income statement For 20Y3....Ch. 9 - Prob. 9.2.1PCh. 9 - Prob. 9.2.2PCh. 9 - Effect of transactions on current position...Ch. 9 - Effect of transactions on current position...Ch. 9 - Twenty metrics of liquidity, solvency, and...Ch. 9 - Twenty metrics of liquidity, solvency, and...Ch. 9 - Twenty metrics of liquidity, solvency, and...Ch. 9 - Twenty metrics of liquidity, solvency, and...Ch. 9 - Twenty metrics of liquidity, solvency, and...Ch. 9 - Twenty metrics of liquidity, solvency, and...Ch. 9 - Prob. 9.4.7PCh. 9 - Twenty metrics of liquidity, solvency, and...Ch. 9 - Twenty metrics of liquidity, solvency, and...Ch. 9 - Twenty metrics of liquidity, solvency, and...Ch. 9 - Twenty metrics of liquidity, solvency, and...Ch. 9 - Twenty metrics of liquidity, solvency, and...Ch. 9 - Twenty metrics of liquidity, solvency, and...Ch. 9 - Twenty metrics of liquidity, solvency, and...Ch. 9 - Twenty metrics of liquidity, solvency, and...Ch. 9 - Twenty metrics of liquidity, solvency, and...Ch. 9 - Twenty metrics of liquidity, solvency, and...Ch. 9 - Twenty metrics of liquidity, solvency, and...Ch. 9 - Twenty metrics of liquidity, solvency, and...Ch. 9 - Prob. 9.4.20PCh. 9 - Trend analysis Critelli Company has provided the...Ch. 9 - Trend analysis Critelli Company has provided the...Ch. 9 - Prob. 9.1CCh. 9 - Prob. 9.2CCh. 9 - Prob. 9.3CCh. 9 - Prob. 9.4.1CCh. 9 - Prob. 9.4.2CCh. 9 - Prob. 9.4.3CCh. 9 - Comprehensive profitability and solvency analysis...Ch. 9 - Comprehensive profitability and solvency analysis...
Knowledge Booster
Learn more about
Need a deep-dive on the concept behind this application? Look no further. Learn more about this topic, accounting and related others by exploring similar questions and additional content below.Similar questions
- The actual cost of direct labor per hour is $16.00 and the standard cost of direct labor per hour is $15.50. The direct labor hours allowed per finished unit is 0.5 hour. During the current period, 5,500 units of finished goods were produced using 3,000 direct labor hours. How much is the direct labor efficiency variance? a. $3,875 favorable b. $3,875 unfavorable c. $4,000 favorable d. $4,000 unfavorablearrow_forwardHii, Tutor Give Answerarrow_forwardNonearrow_forward
- Do fast answer of this accounting questionsarrow_forwardCorrect answerarrow_forwardMilton Company reported inventory of $60,000 at the beginning of 2018. During the year, it purchased inventory of $625,000 and sold inventory for $950,000. A count of inventory at the end of the year determined that the cost of inventory on hand was $50,000. 1. What was Milton's cost of goods sold for 2018? 2. What is Milton's gross margin for the year?arrow_forward
- How many units were completed during the periodarrow_forwardWhat is the return on equity on these financial accounting question?arrow_forwardUse the information given below. Sales $ 4,07,200 Variable cost of goods sold 1,87,300 Variable selling and administrative expenses 44,800 Fixed manufacturing costs Fixed selling and administrative expenses 69,200 24,400 How much is gross profit under absorption costing?arrow_forward
arrow_back_ios
SEE MORE QUESTIONS
arrow_forward_ios
Recommended textbooks for you
 Managerial AccountingAccountingISBN:9781337912020Author:Carl Warren, Ph.d. Cma William B. TaylerPublisher:South-Western College Pub
 Financial And Managerial AccountingAccountingISBN:9781337902663Author:WARREN, Carl S.Publisher:Cengage Learning,
 Financial AccountingAccountingISBN:9781337272124Author:Carl Warren, James M. Reeve, Jonathan DuchacPublisher:Cengage Learning
 Survey of Accounting (Accounting I)AccountingISBN:9781305961883Author:Carl WarrenPublisher:Cengage Learning
 College Accounting, Chapters 1-27AccountingISBN:9781337794756Author:HEINTZ, James A.Publisher:Cengage Learning,
 Managerial Accounting: The Cornerstone of Busines...AccountingISBN:9781337115773Author:Maryanne M. Mowen, Don R. Hansen, Dan L. HeitgerPublisher:Cengage Learning

Managerial Accounting
Accounting
ISBN:9781337912020
Author:Carl Warren, Ph.d. Cma William B. Tayler
Publisher:South-Western College Pub

Financial And Managerial Accounting
Accounting
ISBN:9781337902663
Author:WARREN, Carl S.
Publisher:Cengage Learning,

Financial Accounting
Accounting
ISBN:9781337272124
Author:Carl Warren, James M. Reeve, Jonathan Duchac
Publisher:Cengage Learning

Survey of Accounting (Accounting I)
Accounting
ISBN:9781305961883
Author:Carl Warren
Publisher:Cengage Learning

College Accounting, Chapters 1-27
Accounting
ISBN:9781337794756
Author:HEINTZ, James A.
Publisher:Cengage Learning,

Managerial Accounting: The Cornerstone of Busines...
Accounting
ISBN:9781337115773
Author:Maryanne M. Mowen, Don R. Hansen, Dan L. Heitger
Publisher:Cengage Learning
Financial ratio analysis; Author: The Finance Storyteller;https://www.youtube.com/watch?v=MTq7HuvoGck;License: Standard Youtube License