Profitability metrics
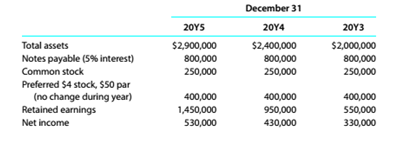
The following selected data were taken from the financial statements of The O'Malley Group Inc. for December 31, 20Y5. 20Y4. and 20Y3:

No dividends on common stock were declared between 20Y3 and 20Y5.
a.Determine the return on total assets, the return on
b. What conclusions can be drawn from these data as to the company's profitability?
(a)
Concept Introduction:
Profitability analysis:
Ithelps to evaluate the ability of a company to generate income relative to revenue, assets, operating cost and shareholders' equity during a specific period.
It measures how efficiently the resources have been utilised to generate profit.
To calculate:
Return on total assets, return on common stockholders' equity and return on stockholders' equity for the year 20Y4 and 20Y5
Explanation of Solution
| Particulars | 20Y5 | 20Y4 |
| Net income | $530,000 | $430,000 |
| Interest on Notes Payable | ||
| Preferred Dividends | $30,000 | $30,000 |
| Particulars | 20Y5 | 20Y4 |
| Common Stock (A) | $250,000 | $250,000 |
| Preferred Stock (B) | $400,000 | $400,000 |
| Retained Earnings (C) | $1,450,000 | $950,000 |
| Total Stockholders' Equity (A+B+C) | $2,100,000 | $1,600,000 |
| Total Common Stockholders' Equity (A+C) | $1,700,000 | $1,200,000 |
| Total Assets (Beginning) | $2,400,000 | $2,000,000 |
| Total Assets (Ending) | $2,900,000 | $2,400,000 |
| Total Assets (Average) | ||
| Return on Total Assets | ||
| Return on Shareholders' Equity | ||
| Return on Common Shareholders' Equity |
Retained Earnings (ending) = Retained Earnings (beginning) + Net Income − Dividends
Retained Earnings (20Y5) = Retained Earnings (20Y4) + Net Income (20Y5) − Dividends (20Y5)
$1,450,000 = $950,000 + $530,000 − Dividends (20Y5)
$1,480,000 - $1,450,000 = Dividends (20Y5)
Dividends (20Y5) = $30,000
Retained Earnings (20Y4) = Retained Earnings (20Y3) + Net Income (20Y4) − Dividends (20Y4)
$950,000 = $550,000 + $430,000 − Dividends (20Y4)
$980,000 - $950,000 = Dividends (20Y4)
Dividends (20Y4) = $30,000
(b)
Concept Introduction:
Profitability analysis:
It is used to evaluate the ability of a company to generate income relative to revenue, assets, operating cost and shareholders' equity during a specific period.
It measures how efficiently the resources have been utilised to generate profit.
To analyze:
The calculated ratios to evaluate company's profitability.
Explanation of Solution
Over the past three years company's profitability has steady increase in terms of return on total assets but a steady decline has been noticed in return on equity and return on common stock.
This is due to the earnings retained each year by the company. Though, the company is unable to utilise it to increase its profitability. Thus, the retained earnings should be utilisedaccurately to generate revenue which will in return improve the profitability of the company.
Want to see more full solutions like this?
Chapter 9 Solutions
Survey of Accounting - With CengageNOW 1Term
- Financial Accountingarrow_forward2.7.12 - Sai Company manufactures and sells a single product. The company's total sales are $150,000 and they sell their product at $30 per unit. Their total fixed expenses are $13,500 and their total operating income is $16,500. How many units were sold? Answerarrow_forward5 pointsarrow_forward
- Seaside Manufacturing Inc. estimated its manufacturing overhead costs for 2023 to be $450,000, based on 150,000 estimated machine hours. The actual machine hours for 2023 were 160,000. The manufacturing overhead account contains debit entries totaling $465,000. Determine whether the manufacturing overhead for 2023 was overallocated or underallocated. (Round your immediate calculations to one decimal place.)arrow_forwardGeneral Accounting Questionarrow_forwardHi expert please give me answer general accounting questionarrow_forward
 College Accounting, Chapters 1-27AccountingISBN:9781337794756Author:HEINTZ, James A.Publisher:Cengage Learning,
 Financial AccountingAccountingISBN:9781337272124Author:Carl Warren, James M. Reeve, Jonathan DuchacPublisher:Cengage Learning
 Managerial AccountingAccountingISBN:9781337912020Author:Carl Warren, Ph.d. Cma William B. TaylerPublisher:South-Western College Pub
 Financial And Managerial AccountingAccountingISBN:9781337902663Author:WARREN, Carl S.Publisher:Cengage Learning,
 Cornerstones of Financial AccountingAccountingISBN:9781337690881Author:Jay Rich, Jeff JonesPublisher:Cengage Learning
 Survey of Accounting (Accounting I)AccountingISBN:9781305961883Author:Carl WarrenPublisher:Cengage Learning


