
Videos
The sodium content of a popular sports drink is listed as 220 mg in a 32-oz bottle. Analysis of 10 bottles indicates a sample
a.
State the hypotheses for a two-tailed test of the claimed sodium content.
Answer to Problem 78CE
Null hypothesis:
Alternative hypothesis:
Explanation of Solution
Calculation:
The given information is that, the mean and standard deviation for a sample of 10 bottles is 228.2 mg and 18.2 mg. That is,
Here, the claim is that the sodium content in a 32-oz bottle is 220 mg.
State the hypotheses for a two-tailed test:
Null hypothesis:
That is, the sodium content in a 32-oz bottle is 220 mg.
Alternative hypothesis:
That is, the sodium content in a 32-oz bottle is not 220 mg.
b.
Find the t test statistic to test the claim.
Answer to Problem 78CE
The test statistic is 1.4248.
Explanation of Solution
Calculation:
Test statistic:
The formula for test statistic is,
Where
Substitute
Thus, the test statistic is 1.4248.
c.
Check whether the sample contradict the manufacturer’s claim or not.
Answer to Problem 78CE
The sample do not contradict the manufacturer’s claim.
Explanation of Solution
Calculation:
Critical value:
For two tailed test,
Degrees of freedom:
Critical value:
Software procedure:
Step-by-step software procedure to obtain critical value using EXCEL is as follows:
- Open an EXCEL file.
- In cell A1, enter the formula “=T.INV(0.975, 9)”
- Output using EXCEL software is given below:
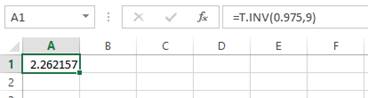
Thus, the critical value of Student’s t is
Decision rule for two-tailed test at
If
If
Conclusion for critical value method:
Here, the test statistic is greater than the critical value.
That is,
Therefore, the null hypothesis is not rejected.
Hence, the sample does not contradict the manufacturer’s claim. That is, there is evidence to infer that the sodium content in a 32-oz bottle is 220 mg.
d.
Find the p-value by using Excel and compare it to the level of significance. Also, check the conclusion for p-value method provide the same conclusion as did in part (c).
Answer to Problem 78CE
The p-value is 0.1880.
The conclusion is that, the sample does not contradict the manufacturer’s claim.
Yes, the conclusion for critical value method and p-value method are same.
Explanation of Solution
Calculation:
p-value:
Software procedure:
Step-by-step software procedure to obtain p-value using EXCEL is as follows:
- Open an EXCEL file.
- In cell A1, enter the formula “=T.DIST.2T(1.4248,9)”.
- Output using Excel software is given below:
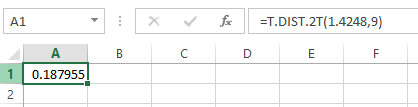
Thus, the p-value is 0.1880.
Decision rule:
If
Conclusion for p-value method:
Here, the p-value is greater than the level of significance.
That is,
Therefore, the null hypothesis is not rejected.
Hence, the sample do not contradict the manufacturer’s claim. That is, there is evidence to infer that the sodium content in a 32-oz bottle is 220 mg. Moreover, the conclusion for critical value method and p-value method are same.
Want to see more full solutions like this?
Chapter 9 Solutions
APPLIED STAT.IN BUS.+ECONOMICS


- A company found that the daily sales revenue of its flagship product follows a normal distribution with a mean of $4500 and a standard deviation of $450. The company defines a "high-sales day" that is, any day with sales exceeding $4800. please provide a step by step on how to get the answers in excel Q: What percentage of days can the company expect to have "high-sales days" or sales greater than $4800? Q: What is the sales revenue threshold for the bottom 10% of days? (please note that 10% refers to the probability/area under bell curve towards the lower tail of bell curve) Provide answers in the yellow cellsarrow_forwardFind the critical value for a left-tailed test using the F distribution with a 0.025, degrees of freedom in the numerator=12, and degrees of freedom in the denominator = 50. A portion of the table of critical values of the F-distribution is provided. Click the icon to view the partial table of critical values of the F-distribution. What is the critical value? (Round to two decimal places as needed.)arrow_forwardA retail store manager claims that the average daily sales of the store are $1,500. You aim to test whether the actual average daily sales differ significantly from this claimed value. You can provide your answer by inserting a text box and the answer must include: Null hypothesis, Alternative hypothesis, Show answer (output table/summary table), and Conclusion based on the P value. Showing the calculation is a must. If calculation is missing,so please provide a step by step on the answers Numerical answers in the yellow cellsarrow_forward
 Glencoe Algebra 1, Student Edition, 9780079039897...AlgebraISBN:9780079039897Author:CarterPublisher:McGraw Hill