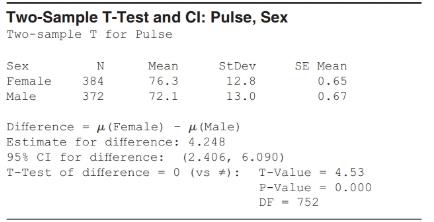
Pulse Rates Using data from NHANES, we looked at the pulse rates of nearly 800 people to see whether men or women tended to have higher pulse rates. Refer to the Minitab output provided. a. Report the sample means, and state which group had the higher sample mean pulse rate. b. Use the Minitab output to test the hypothesis that pulse rates for men and women are not equal, using a significance level of 0.05 . The samples are large enough so that Normality is not an issue.
Pulse Rates Using data from NHANES, we looked at the pulse rates of nearly 800 people to see whether men or women tended to have higher pulse rates. Refer to the Minitab output provided. a. Report the sample means, and state which group had the higher sample mean pulse rate. b. Use the Minitab output to test the hypothesis that pulse rates for men and women are not equal, using a significance level of 0.05 . The samples are large enough so that Normality is not an issue.
Solution Summary: The author explains that the sample mean pulse rate of women is 76.3, which is higher than that of men. The two samples are independent of each other.
Pulse Rates Using data from NHANES, we looked at the pulse rates of nearly 800 people to see whether men or women tended to have higher pulse rates. Refer to the Minitab output provided.
a. Report the sample means, and state which group had the higher sample mean pulse rate.
b. Use the Minitab output to test the hypothesis that pulse rates for men and women are not equal, using a significance level of
0.05
. The samples are large enough so that Normality is not an issue.
Definition Definition Number of subjects or observations included in a study. A large sample size typically provides more reliable results and better representation of the population. As sample size and width of confidence interval are inversely related, if the sample size is increased, the width of the confidence interval decreases.
The following data represent total ventilation measured in liters of air per minute per square meter of body area for two independent (and randomly chosen) samples.
Analyze these data using the appropriate non-parametric hypothesis test
each column represents before & after measurements on the same individual. Analyze with the appropriate non-parametric hypothesis test for a paired design.
Should you be confident in applying your regression equation to estimate the heart rate of a python at 35°C? Why or why not?
Need a deep-dive on the concept behind this application? Look no further. Learn more about this topic, statistics and related others by exploring similar questions and additional content below.
Probability & Statistics (28 of 62) Basic Definitions and Symbols Summarized; Author: Michel van Biezen;https://www.youtube.com/watch?v=21V9WBJLAL8;License: Standard YouTube License, CC-BY
Introduction to Probability, Basic Overview - Sample Space, & Tree Diagrams; Author: The Organic Chemistry Tutor;https://www.youtube.com/watch?v=SkidyDQuupA;License: Standard YouTube License, CC-BY


 Glencoe Algebra 1, Student Edition, 9780079039897...AlgebraISBN:9780079039897Author:CarterPublisher:McGraw Hill
 College Algebra (MindTap Course List)AlgebraISBN:9781305652231Author:R. David Gustafson, Jeff HughesPublisher:Cengage Learning
 Holt Mcdougal Larson Pre-algebra: Student Edition...AlgebraISBN:9780547587776Author:HOLT MCDOUGALPublisher:HOLT MCDOUGAL