
INTRODUCTORY STAT. W/MYLAB MATH>CUSTOM<
3rd Edition
ISBN: 9780135231548
Author: Gould
Publisher: PEARSON C
expand_more
expand_more
format_list_bulleted
Videos
Textbook Question
Chapter 9, Problem 28SE
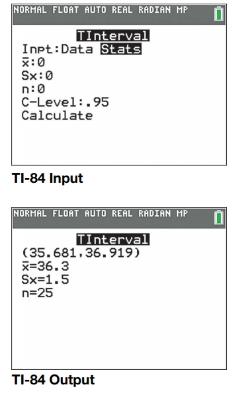
Drinks A fast-food chain sells drinks that it calls HUGE. When we take a sample of 25 drinks and weigh them, we find that the
a. State how you would fill in the numbers below to do the calculation with a TI-84.
b. Report the confidence interval in a carefully worded sentence.
Expert Solution & Answer
Want to see the full answer?
Check out a sample textbook solution
Students have asked these similar questions
For each of the time series, construct a line chart of the data and identify the characteristics of the time series (that is, random, stationary, trend, seasonal, or cyclical).
Year Month Rate (%)2009 Mar 8.72009 Apr 9.02009 May 9.42009 Jun 9.52009 Jul 9.52009 Aug 9.62009 Sep 9.82009 Oct 10.02009 Nov 9.92009 Dec 9.92010 Jan 9.82010 Feb 9.82010 Mar 9.92010 Apr 9.92010 May 9.62010 Jun 9.42010 Jul 9.52010 Aug 9.52010 Sep 9.52010 Oct 9.52010 Nov 9.82010 Dec 9.32011 Jan 9.12011 Feb 9.02011 Mar 8.92011 Apr 9.02011 May 9.02011 Jun 9.12011 Jul 9.02011 Aug 9.02011 Sep 9.02011 Oct 8.92011 Nov 8.62011 Dec 8.52012 Jan 8.32012 Feb 8.32012 Mar 8.22012 Apr 8.12012 May 8.22012 Jun 8.22012 Jul 8.22012 Aug 8.12012 Sep 7.82012 Oct…
For each of the time series, construct a line chart of the data and identify the characteristics of the time series (that is, random, stationary, trend, seasonal, or cyclical).
Date IBM9/7/2010 $125.959/8/2010 $126.089/9/2010 $126.369/10/2010 $127.999/13/2010 $129.619/14/2010 $128.859/15/2010 $129.439/16/2010 $129.679/17/2010 $130.199/20/2010 $131.79
a. Construct a line chart of the closing stock prices data. Choose the correct chart below.
For each of the time series, construct a line chart of the data and identify the characteristics of the time series (that is, random, stationary, trend, seasonal, or cyclical)
Date IBM9/7/2010 $125.959/8/2010 $126.089/9/2010 $126.369/10/2010 $127.999/13/2010 $129.619/14/2010 $128.859/15/2010 $129.439/16/2010 $129.679/17/2010 $130.199/20/2010 $131.79
Chapter 9 Solutions
INTRODUCTORY STAT. W/MYLAB MATH>CUSTOM<
Ch. 9 - Ages A study of all the students at a small...Ch. 9 - Units A survey of 100 random full-time students at...Ch. 9 - Exam Scores The distribution of the scores on a...Ch. 9 - Exam Scores The distribution of the scores on a...Ch. 9 - Showers According to home-water-works.org, the...Ch. 9 - Smartphones According to a 2017 report by ComScore...Ch. 9 - Retirement Income Several times during the year,...Ch. 9 - Time Employed A human resources manager for a...Ch. 9 - Driving (Example 1) Drivers in Wyoming drive more...Ch. 9 - Driving Drivers in Alaska drive fewer miles yearly...
Ch. 9 - Babies Weights (Example 2) Some sources report...Ch. 9 - Babies’ Weights, Again Some sources report that...Ch. 9 - (Example 3) Income in Maryland According to a 2018...Ch. 9 - Income in Kansas According to a 2018 Money...Ch. 9 - CLT Shapes (Example 4) One of the histograms is a...Ch. 9 - Used Van Costs One histogram shows the...Ch. 9 - (Example 5) Age of Used Vans The mean age of all...Ch. 9 - Student Ages The mean age of all 2550 students at...Ch. 9 - Prob. 19SECh. 9 - Prob. 20SECh. 9 - Prob. 21SECh. 9 - Prob. 22SECh. 9 - Private University Tuition (Example 7) A random...Ch. 9 - Random Numbers If you take samples of 40 lines...Ch. 9 - t* (Example 8) A researcher collects one sample of...Ch. 9 - t* A researcher collects a sample of 25...Ch. 9 - Heights of 12th Graders (Example 9) A random...Ch. 9 - Drinks A fast-food chain sells drinks that it...Ch. 9 - Men’s Pulse Rates (Example 10) A random sample of...Ch. 9 - Travel Time to School A random sample of 50...Ch. 9 - RBIs (Example 11) A random sample of 25 baseball...Ch. 9 - RBIs Again In exercise 9.31, two intervals were...Ch. 9 - Confidence Interval Changes State whether each of...Ch. 9 - Confidence Interval Changes State whether each of...Ch. 9 - Potatoes The weights of four randomly and...Ch. 9 - Tomatoes The weights of four randomly and...Ch. 9 - Human Body Temperatures (Example 12) A random...Ch. 9 - Reaction Distance Data on the disk and website...Ch. 9 - Potatoes Use the data from exercise 9.35. a. If...Ch. 9 - Tomatoes Use the data from exercise 9.36. a. Using...Ch. 9 - Cholesterol In the U.S. Department of Health has...Ch. 9 - BMI A body mass index (BMI) of more than 25 is...Ch. 9 - Male Height In the United States, the population...Ch. 9 - Female Height In the United States, the population...Ch. 9 - Deflated Footballs? Patriots In the 2015 AFC...Ch. 9 - Deflated Footballs? Colts In the 2015 AFC...Ch. 9 - Movie Ticket Prices According to Deadline.com, the...Ch. 9 - Broadway Ticket Prices According to Statista.com,...Ch. 9 - Atkins Diet Difference Ten people went on an...Ch. 9 - Pulse Difference The following numbers are the...Ch. 9 - Student Ages Suppose that 200 statistics students...Ch. 9 - Presidents’ Ages at Inauguration A 95 confidence...Ch. 9 - Independent or Paired (Example 13) State whether...Ch. 9 - Independent or Paired State whether each situation...Ch. 9 - Televisions: CI (Example 14) Minitab output is...Ch. 9 - Pulse and Gender: CI Using data from NHANES, we...Ch. 9 - Televisions (Example 15) The table shows the...Ch. 9 - Pulse Rates Using data from NHANES, we looked at...Ch. 9 - Triglycerides Triglycerides are a form of fat...Ch. 9 - Systolic Blood Pressures When you have your blood...Ch. 9 - Triglycerides, Again Report and interpret the 95...Ch. 9 - Blood Pressures, Again Report and interpret the 95...Ch. 9 - Baseball Salaries A random sample of 40...Ch. 9 - College Athletes’ Weights A random sample of male...Ch. 9 - Baseball Salaries In exercise 9.63 you could not...Ch. 9 - College Athletes’ Weights In exercise 9.64, you...Ch. 9 - Textbook Prices, UCSB vs. CSUN (Example 16) The...Ch. 9 - Textbook Prices. OC vs. CSUN The prices of a...Ch. 9 - Females’ Pulse Rates before and after a Fright...Ch. 9 - Males’ Pulse Rates before and after a Fright...Ch. 9 - Organic Food A student compared organic food...Ch. 9 - Body Temperature The body temperatures of 65 men...Ch. 9 - Ales vs. IPAs Data were collected on calorie...Ch. 9 - Surfers Surfers and statistics students Rex...Ch. 9 - Self-Reported Heights of Men (Example 18) A random...Ch. 9 - Eating Out Jacqueline Loya, a statistics student,...Ch. 9 - Prob. 77SECh. 9 - Self-Driving Cars A survey of asked respondents...Ch. 9 - Women’s Heights Assume women’s heights are...Ch. 9 - Showers According to home-water-works.org, the...Ch. 9 - Choose a test for each situation: one-sample...Ch. 9 - Choose a t-test for each situation: one-sample...Ch. 9 - Cones: 3 Tests A McDonald’s fact sheet says its...Ch. 9 - Prob. 84CRECh. 9 - Brain Size Brain size for 20 random women and 20...Ch. 9 - Reducing Pollution A random sample of 12th-grade...Ch. 9 - Heart Rate before and after Coffee Elena Lucin, a...Ch. 9 - Exam Grades The final exam grades for a sample of...Ch. 9 - Hours of Television Viewing The number of hours...Ch. 9 - Reaction Distances Reaction distances in...Ch. 9 - Ales vs. Lagers Data were collected on calorie...Ch. 9 - Weights of Hockey and Baseball Players Data were...Ch. 9 - Grocery Delivery The table shows the prices for...Ch. 9 - Parents The following table shows the heights (in...Ch. 9 - Why Is n1 in the Sample Standard Deviation? Why do...Ch. 9 - Prob. 96CRECh. 9 - Construct two sets of body temperatures (in...Ch. 9 - Construct heights for 3 or more sets of twins (6...
Additional Math Textbook Solutions
Find more solutions based on key concepts
Is there a relationship between wine consumption and deaths from heart disease? The table gives data from 19 de...
College Algebra Essentials (5th Edition)
Provide an example of a qualitative variable and an example of a quantitative variable.
Elementary Statistics ( 3rd International Edition ) Isbn:9781260092561
(a) Make a stem-and-leaf plot for these 24 observations on the number of customers who used a down-town CitiBan...
APPLIED STAT.IN BUS.+ECONOMICS
For Exercises 13–18, write the negation of the statement.
13. The cell phone is out of juice.
Math in Our World
Use the ideas in drawings a and b to find the solution to Gausss Problem for the sum 1+2+3+...+n. Explain your ...
A Problem Solving Approach To Mathematics For Elementary School Teachers (13th Edition)
1. How is a sample related to a population?
Elementary Statistics: Picturing the World (7th Edition)
Knowledge Booster


Learn more about
Need a deep-dive on the concept behind this application? Look no further. Learn more about this topic, statistics and related others by exploring similar questions and additional content below.Similar questions
- 1. A consumer group claims that the mean annual consumption of cheddar cheese by a person in the United States is at most 10.3 pounds. A random sample of 100 people in the United States has a mean annual cheddar cheese consumption of 9.9 pounds. Assume the population standard deviation is 2.1 pounds. At a = 0.05, can you reject the claim? (Adapted from U.S. Department of Agriculture) State the hypotheses: Calculate the test statistic: Calculate the P-value: Conclusion (reject or fail to reject Ho): 2. The CEO of a manufacturing facility claims that the mean workday of the company's assembly line employees is less than 8.5 hours. A random sample of 25 of the company's assembly line employees has a mean workday of 8.2 hours. Assume the population standard deviation is 0.5 hour and the population is normally distributed. At a = 0.01, test the CEO's claim. State the hypotheses: Calculate the test statistic: Calculate the P-value: Conclusion (reject or fail to reject Ho): Statisticsarrow_forward21. find the mean. and variance of the following: Ⓒ x(t) = Ut +V, and V indepriv. s.t U.VN NL0, 63). X(t) = t² + Ut +V, U and V incepires have N (0,8) Ut ①xt = e UNN (0162) ~ X+ = UCOSTE, UNNL0, 62) SU, Oct ⑤Xt= 7 where U. Vindp.rus +> ½ have NL, 62). ⑥Xn = ΣY, 41, 42, 43, ... Yn vandom sample K=1 Text with mean zen and variance 6arrow_forwardA psychology researcher conducted a Chi-Square Test of Independence to examine whether there is a relationship between college students’ year in school (Freshman, Sophomore, Junior, Senior) and their preferred coping strategy for academic stress (Problem-Focused, Emotion-Focused, Avoidance). The test yielded the following result: image.png Interpret the results of this analysis. In your response, clearly explain: Whether the result is statistically significant and why. What this means about the relationship between year in school and coping strategy. What the researcher should conclude based on these findings.arrow_forward
- A school counselor is conducting a research study to examine whether there is a relationship between the number of times teenagers report vaping per week and their academic performance, measured by GPA. The counselor collects data from a sample of high school students. Write the null and alternative hypotheses for this study. Clearly state your hypotheses in terms of the correlation between vaping frequency and academic performance. EditViewInsertFormatToolsTable 12pt Paragrapharrow_forwardA smallish urn contains 25 small plastic bunnies – 7 of which are pink and 18 of which are white. 10 bunnies are drawn from the urn at random with replacement, and X is the number of pink bunnies that are drawn. (a) P(X = 5) ≈ (b) P(X<6) ≈ The Whoville small urn contains 100 marbles – 60 blue and 40 orange. The Grinch sneaks in one night and grabs a simple random sample (without replacement) of 15 marbles. (a) The probability that the Grinch gets exactly 6 blue marbles is [ Select ] ["≈ 0.054", "≈ 0.043", "≈ 0.061"] . (b) The probability that the Grinch gets at least 7 blue marbles is [ Select ] ["≈ 0.922", "≈ 0.905", "≈ 0.893"] . (c) The probability that the Grinch gets between 8 and 12 blue marbles (inclusive) is [ Select ] ["≈ 0.801", "≈ 0.760", "≈ 0.786"] . The Whoville small urn contains 100 marbles – 60 blue and 40 orange. The Grinch sneaks in one night and grabs a simple random sample (without replacement) of 15 marbles. (a)…arrow_forwardSuppose an experiment was conducted to compare the mileage(km) per litre obtained by competing brands of petrol I,II,III. Three new Mazda, three new Toyota and three new Nissan cars were available for experimentation. During the experiment the cars would operate under same conditions in order to eliminate the effect of external variables on the distance travelled per litre on the assigned brand of petrol. The data is given as below: Brands of Petrol Mazda Toyota Nissan I 10.6 12.0 11.0 II 9.0 15.0 12.0 III 12.0 17.4 13.0 (a) Test at the 5% level of significance whether there are signi cant differences among the brands of fuels and also among the cars. [10] (b) Compute the standard error for comparing any two fuel brands means. Hence compare, at the 5% level of significance, each of fuel brands II, and III with the standard fuel brand I. [10] �arrow_forward
- Analyze the residuals of a linear regression model and select the best response. yes, the residual plot does not show a curve no, the residual plot shows a curve yes, the residual plot shows a curve no, the residual plot does not show a curve I answered, "No, the residual plot shows a curve." (and this was incorrect). I am not sure why I keep getting these wrong when the answer seems obvious. Please help me understand what the yes and no references in the answer.arrow_forwarda. Find the value of A.b. Find pX(x) and py(y).c. Find pX|y(x|y) and py|X(y|x)d. Are x and y independent? Why or why not?arrow_forwardAnalyze the residuals of a linear regression model and select the best response.Criteria is simple evaluation of possible indications of an exponential model vs. linear model) no, the residual plot does not show a curve yes, the residual plot does not show a curve yes, the residual plot shows a curve no, the residual plot shows a curve I selected: yes, the residual plot shows a curve and it is INCORRECT. Can u help me understand why?arrow_forward
arrow_back_ios
SEE MORE QUESTIONS
arrow_forward_ios
Recommended textbooks for you
 Glencoe Algebra 1, Student Edition, 9780079039897...AlgebraISBN:9780079039897Author:CarterPublisher:McGraw Hill
 Big Ideas Math A Bridge To Success Algebra 1: Stu...AlgebraISBN:9781680331141Author:HOUGHTON MIFFLIN HARCOURTPublisher:Houghton Mifflin Harcourt
Glencoe Algebra 1, Student Edition, 9780079039897...
Algebra
ISBN:9780079039897
Author:Carter
Publisher:McGraw Hill
Big Ideas Math A Bridge To Success Algebra 1: Stu...
Algebra
ISBN:9781680331141
Author:HOUGHTON MIFFLIN HARCOURT
Publisher:Houghton Mifflin Harcourt
Hypothesis Testing using Confidence Interval Approach; Author: BUM2413 Applied Statistics UMP;https://www.youtube.com/watch?v=Hq1l3e9pLyY;License: Standard YouTube License, CC-BY
Hypothesis Testing - Difference of Two Means - Student's -Distribution & Normal Distribution; Author: The Organic Chemistry Tutor;https://www.youtube.com/watch?v=UcZwyzwWU7o;License: Standard Youtube License