Concept explainers
Videos
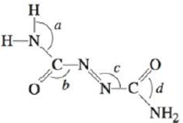
Two molecules used in the
Azodicarbonamide
Methyl cyanoracy late
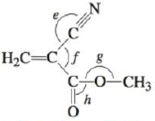
Azodicarbonamide is used in forming polystyrene. When added to the molten plastic, it decomposes to nitrogen, carbon monoxide, and ammonia gases, which are captured as bubbles in the molten polymer. Methyl cyanoacrylate is the main ingredient in super glue. As the glue sets, methyl cyanoacrylate
a. Complete the Lewis structures showing all lone pairs of electrons.
b. Which hybrid orbitals are used by the carbon atoms in each molecule and the nitrogen atom in azodicarbonamide?
c. How many π bonds are present in each molecule?
d. Give approximate values for the bond angles marked a through h in the previous structures.

Trending nowThis is a popular solution!

Chapter 9 Solutions
Student Solutions Manual for Zumdahl/Zumdahl/DeCoste?s Chemistry, 10th Edition


- pressure (atm) 3 The pressure on a sample of pure X held at 47. °C and 0.88 atm is increased until the sample condenses. The pressure is then held constant and the temperature is decreased by 82. °C. On the phase diagram below draw a path that shows this set of changes. 0 0 200 temperature (K) 400 аarrow_forwarder your payment details | bar xb Home | bartleby x + aleksogi/x/isl.exe/1o u-lgNskr7j8P3jH-1Qs_pBanHhviTCeeBZbufuBYT0Hz7m7D3ZcW81NC1d8Kzb4srFik1OUFhKMUXzhGpw7k1 O States of Matter Sketching a described thermodynamic change on a phase diagram 0/5 The pressure on a sample of pure X held at 47. °C and 0.88 atm is increased until the sample condenses. The pressure is then held constant and the temperature is decreased by 82. °C. On the phase diagram below draw a path that shows this set of changes. pressure (atm) 1 3- 0- 0 200 Explanation Check temperature (K) 400 X Q Search L G 2025 McGraw Hill LLC. All Rights Reserved Terms of Use Privacy Cearrow_forward5.arrow_forward
- 6.arrow_forward0/5 alekscgi/x/sl.exe/1o_u-IgNglkr7j8P3jH-IQs_pBaHhvlTCeeBZbufuBYTi0Hz7m7D3ZcSLEFovsXaorzoFtUs | AbtAURtkqzol 1HRAS286, O States of Matter Sketching a described thermodynamic change on a phase diagram The pressure on a sample of pure X held at 47. °C and 0.88 atm is increased until the sample condenses. The pressure is then held constant and the temperature is decreased by 82. °C. On the phase diagram below draw a path that shows this set of changes. 3 pressure (atm) + 0- 0 5+ 200 temperature (K) 400 Explanation Check X 0+ F3 F4 F5 F6 F7 S 2025 McGraw Hill LLC All Rights Reserved. Terms of Use Privacy Center Accessibility Q Search LUCR + F8 F9 F10 F11 F12 * % & ( 5 6 7 8 9 Y'S Dele Insert PrtSc + Backsarrow_forward5.arrow_forward
- 9arrow_forwardalekscgi/x/lsl.exe/1o_u-IgNslkr7j8P3jH-IQs_pBanHhvlTCeeBZbufu BYTI0Hz7m7D3ZS18w-nDB10538ZsAtmorZoFusYj2Xu9b78gZo- O States of Matter Sketching a described thermodynamic change on a phase diagram 0/5 The pressure on a sample of pure X held at 47. °C and 0.88 atm is increased until the sample condenses. The pressure is then held constant and the temperature is decreased by 82. °C. On the phase diagram below draw a path that shows this set of changes. pressure (atm) 3- 200 temperature (K) Explanation Chick Q Sowncharrow_forward0+ aleksog/x/lsl.exe/1ou-lgNgkr7j8P3H-IQs pBaHhviTCeeBZbufuBYTOHz7m7D3ZStEPTBSB3u9bsp3Da pl19qomOXLhvWbH9wmXW5zm O States of Matter Sketching a described thermodynamic change on a phase diagram 0/5 Gab The temperature on a sample of pure X held at 0.75 atm and -229. °C is increased until the sample sublimes. The temperature is then held constant and the pressure is decreased by 0.50 atm. On the phase diagram below draw a path that shows this set of changes. F3 pressure (atm) 0- 0 200 Explanation temperature (K) Check F4 F5 ☀+ Q Search Chill Will an 9 ENG F6 F7 F8 F9 8 Delete F10 F11 F12 Insert PrtSc 114 d Ararrow_forward
- x + LEKS: Using a phase diagram a X n/alekscgi/x/lsl.exe/10_u-IgNsikr7j8P3jH-IQs_pBan HhvlTCeeBZbufu BYTI0Hz7m7D3ZcHYUt80XL-5alyVpw ○ States of Matter Using a phase diagram to find a phase transition temperature or pressure Use the phase diagram of Substance X below to find the melting point of X when the pressure above the solid is 1.1 atm. pressure (atm) 16 08- solid liquid- 0 200 400 gas 600 temperature (K) Note: your answer must be within 25 °C of the exact answer to be graded correct. × 5arrow_forwardS: Using a phase diagram leksogi/x/sl.exe/1ou-IgNs kr 7j8P3jH-IQs_pBan HhvTCeeBZbufuBYTI0Hz7m7D3ZdHYU+80XL-5alyVp O States of Matter Using a phase diagram to find a phase transition temperature or pressure se the phase diagram of Substance X below to find the boiling point of X when the pressure on the liquid is 1.6 atm. pressure (atm) 32- 16- solid liquid 0. gas 100 200 temperature (K) 300 Note: your answer must be within 12.5 °C of the exact answer to be graded correct. 10 Explanation Check § Q Search J 2025 McGraw Hill LLC. All Rights Researrow_forward151.2 254.8 85.9 199.6 241.4 87.6 242.5 186.4 155.8 257.1 242.9 253.3 256.0 216.6 108.7 239.0 149.7 236.4 152.1 222.7 148.7 278.2 268.7 234.4 262.7 283.2 143.6 QUESTION: Using this group of data on salt reduced tomato sauce concentration readings answer the following questions: 1. 95% Cl Confidence Interval (mmol/L) 2. [Na+] (mg/100 mL) 3. 95% Na+ Confidence Interval (mg/100 mL)arrow_forward

 ChemistryChemistryISBN:9781305957404Author:Steven S. Zumdahl, Susan A. Zumdahl, Donald J. DeCostePublisher:Cengage Learning
 Chemistry: An Atoms First ApproachChemistryISBN:9781305079243Author:Steven S. Zumdahl, Susan A. ZumdahlPublisher:Cengage Learning
 Introductory Chemistry: An Active Learning Approa...ChemistryISBN:9781305079250Author:Mark S. Cracolice, Ed PetersPublisher:Cengage Learning
 Chemistry: The Molecular ScienceChemistryISBN:9781285199047Author:John W. Moore, Conrad L. StanitskiPublisher:Cengage Learning
 Chemistry for Engineering StudentsChemistryISBN:9781337398909Author:Lawrence S. Brown, Tom HolmePublisher:Cengage Learning