
the table given and calculate the asked questions.
Concept Introduction:
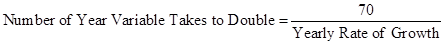
Rule of 70: It is a numerical formula to determine the time period, that a variable will take to double itself.
Formula to calculate number of years variable will take to double itself:

Here:
- R is current constant growth rate.
- N is number of year it will take to be double.
Answer to Problem 3P
a. Ratio of per capita GDP in 2012.
i. Middle-income to high-income countries.
Given,
Real GDP of middle-income country in 2015 is $4,584.
Real GDP of high-income country in 2015 is $41,038.
Formula to calculate ratio of per capita GDP of middle-income country to high-income country,
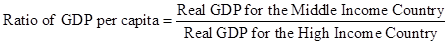
Substitute $4,584 for real GDP for the middle-income country and $41,038 for real GDP for the high-income country.
In the given case, ratio of per capita GDP of middle-income country to high-income country is 0.112.
ii. Low-income to high-income countries.
Given,
Real GDP of low-income country in 2015 is $588.
Real GDP of high-income country 2015 is $41,038.
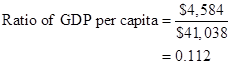
Formula to calculate ratio of per capita GDP of low-income country to high-income country,

Substitute $588 for real GDP for the low-income country and $41,038 for real GDP for the high-income country.
In the given case, ratio of per capita GDP of low-income country to high-income country is 0.014.
iii. Low-income to middle-income countries.
Given:
Real GDP of low-income country in 2015 is $588.
Real GDP of middle-income country in 2015 is $4,584.
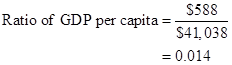
Formula to calculate ratio of per capita GDP of low-income country to middle-income country,

Substitute $588 for real GDP for the low-income country and $4,584 for real GDP for the middle-income country.
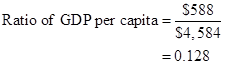
In the given case, ratio of per capita GDP of low-income country to middle-income country is 0.128.
b. Number of years taken by the low income and middle-income countries to double their per capita GDP.
Given,
Growth rate of low-income country is 2.3%.
Growth rate of middle-income country is 4.4%.
Formula to calculate number of year variable takes to double,
 (I)
(I) According to the given case, to double GDP the low-income country and middle-income country will take 30 years and 16 years respectively.
Number of years taken by low-income country to double its GDP.
Substitute 2.3 for yearly rate of growth in (I).
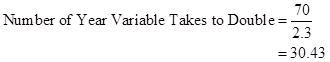
Therefore, to double GDP the low-income country will take 30 years.
Number of years taken by middle-income country to double its GDP.
Substitute 4.4 for yearly rate of growth in (I).
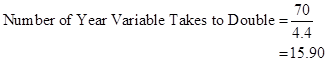
Therefore, to double GDP the middle-income country will take 16 years.
c. Per capita GDP of each of the regions in 2085.
Given,
Growth rate of high-income country is 1.0%.
Growth rate of low-income country is 2.3%.
Growth rate of middle-income country is 4.4%.
Formula to calculate number of year variable takes to double,

Substitute 1.0 for yearly rate of growth in (I).
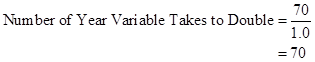
- Therefore, in 70 years, which will be in 2085, GDP per capita of high-income countries will be $82,076

- If per capita GDP is to be projected then middle-income country will double its per capita GDP by 4 times
 Therefore, in 2085 per capita GDP of middle-income country will be $73,344
- If per capita GDP is to be projected then low-income country, will double its per capita GDP by 2 times
 Therefore, in 2085 per capita GDP of low-income country will be $2,352
d. Projected per capita GDP in 2085.
Calculated (in part c. ),
Real GDP of low-income country in 2085 is $2,352.
Real GDP of middle-income country in 2085 is $73,344.
Real GDP of high-income country in 2085 is $82,076.
Middle-income to high-income countries.
Formula to calculate ratio of per capita GDP of middle-income country to high-income country,

Substitute $73,344. for real GDP for the middle-income country and $82,076 for real GDP for the high-income country.
Thus, ratio of per capita GDP of middle-income country to high-income country is 0.893.
Low-income to high-income countries.
Formula to calculate ratio of per capita GDP of low-income country to high-income country,
Substitute $2,352 for real GDP for the low-income country and $82,076 for real GDP for the high-income country.
Thus, ratio of per capita GDP of low-income country to high-income country is 0.028.
Low-income to middle-income countries.
Formula to calculate ratio of per capita GDP of low-income country to middle-income country,
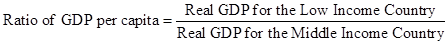
Substitute $2,352 for real GDP for the low-income country and $73,344 for real GDP for the middle-income country.
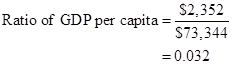
Thus, ratio of per capita GDP of low-income country to middle-income country is 0.032.
e. Comparison of part a. and part d.
According to the data calculated in the above parts the inequality between low-income countries and middle-income countries will increase with time.
Explanation of Solution
- According to the calculated data, per capita GDP of low-income country and middle-income country have improved but per capita GDP of high-income country has not improved that much.
- According to the calculated data, the growth middle-income countries are so fast that its growth in 2085 will surpass the present high-income countries growth.
- The middle-income is growing at much faster rate as compared to low-income countries. Therefore, the inequality between low-income countries and middle-income countries will increase.
Want to see more full solutions like this?

- Title: Does the educational performance depend on its literacy rate and government spending over the last 10 years? In the introduction, there are four things to include:a) Clearly state your research topic follows by country’s background in terms of (population density; male/female ratio; and identify the problem leading up to the study of it, such as government spending and adult literacy rate. How does the US perform compared to other countries.b) State the research question that you wish to resolve: Does the US economic performance depend on its government spending on education and the literacy rate over the last 10 years. Define performance (Y) as the average income per capita, an indicator of the country’s economy growing over time. For example, an increase in government spending leads to higher literacy rates and subsequently higher productivity in the economy. Also, mention that you will use a sample size of 10 years of secondary data from the existing literature,…arrow_forwardTitle: Does the educational performance depend on its literacy rate and government spending over the last 10 years? In the introduction, there are four things to include:a) Clearly state your research topic follows by country’s background in terms of (population density; male/female ratio; and identify the problem leading up to the study of it, such as government spending and adult literacy rate. How does the US perform compared to other countries.b) State the research question that you wish to resolve: Does the US economic performance depend on its government spending on education and the literacy rate over the last 10 years. Define performance (Y) as the average income per capita, an indicator of the country’s economy growing over time. For example, an increase in government spending leads to higher literacy rates and subsequently higher productivity in the economy. Also, mention that you will use a sample size of 10 years of secondary data from the existing literature,…arrow_forwardExplain how the introduction of egg replacers and plant-based egg products will impact the bakery industry. Provide a graphical representation.arrow_forward
- Explain Professor Frederick's "cognitive reflection" test.arrow_forward11:44 Fri Apr 4 Would+You+Take+the+Bird+in+the+Hand Would You Take the Bird in the Hand, or a 75% Chance at the Two in the Bush? BY VIRGINIA POSTREL WOULD you rather have $1,000 for sure or a 90 percent chance of $5,000? A guaranteed $1,000 or a 75 percent chance of $4,000? In economic theory, questions like these have no right or wrong answers. Even if a gamble is mathematically more valuable a 75 percent chance of $4,000 has an expected value of $3,000, for instance someone may still prefer a sure thing. People have different tastes for risk, just as they have different tastes for ice cream or paint colors. The same is true for waiting: Would you rather have $400 now or $100 every year for 10 years? How about $3,400 this month or $3,800 next month? Different people will answer differently. Economists generally accept those differences without further explanation, while decision researchers tend to focus on average behavior. In decision research, individual differences "are regarded…arrow_forwardDescribe the various measures used to assess poverty and economic inequality. Analyze the causes and consequences of poverty and inequality, and discuss potential policies and programs aimed at reducing them, assess the adequacy of current environmental regulations in addressing negative externalities. analyze the role of labor unions in labor markets. What is one benefit, and one challenge associated with labor unions.arrow_forward
- Evaluate the effectiveness of supply and demand models in predicting labor market outcomes. Justify your assessment with specific examples from real-world labor markets.arrow_forwardExplain the difference between Microeconomics and Macroeconomics? 2.) Explain what fiscal policy is and then explain what Monetary Policy is? 3.) Why is opportunity cost and give one example from your own of opportunity cost. 4.) What are models and what model did we already discuss in class? 5.) What is meant by scarcity of resources?arrow_forward2. What is the payoff from a long futures position where you are obligated to buy at the contract price? What is the payoff from a short futures position where you are obligated to sell at the contract price?? Draw the payoff diagram for each position. Payoff from Futures Contract F=$50.85 S1 Long $100 $95 $90 $85 $80 $75 $70 $65 $60 $55 $50.85 $50 $45 $40 $35 $30 $25 Shortarrow_forward
- 3. Consider a call on the same underlier (Cisco). The strike is $50.85, which is the forward price. The owner of the call has the choice or option to buy at the strike. They get to see the market price S1 before they decide. We assume they are rational. What is the payoff from owning (also known as being long) the call? What is the payoff from selling (also known as being short) the call? Payoff from Call with Strike of k=$50.85 S1 Long $100 $95 $90 $85 $80 $75 $70 $65 $60 $55 $50.85 $50 $45 $40 $35 $30 $25 Shortarrow_forward4. Consider a put on the same underlier (Cisco). The strike is $50.85, which is the forward price. The owner of the call has the choice or option to buy at the strike. They get to see the market price S1 before they decide. We assume they are rational. What is the payoff from owning (also known as being long) the put? What is the payoff from selling (also known as being short) the put? Payoff from Put with Strike of k=$50.85 S1 Long $100 $95 $90 $85 $80 $75 $70 $65 $60 $55 $50.85 $50 $45 $40 $35 $30 $25 Shortarrow_forwardThe following table provides information on two technology companies, IBM and Cisco. Use the data to answer the following questions. Company IBM Cisco Systems Stock Price Dividend (trailing 12 months) $150.00 $50.00 $7.00 Dividend (next 12 months) $7.35 Dividend Growth 5.0% $2.00 $2.15 7.5% 1. You buy a futures contract instead of purchasing Cisco stock at $50. What is the one-year futures price, assuming the risk-free interest rate is 6%? Remember to adjust the futures price for the dividend of $2.15.arrow_forward

 Principles of Economics (12th Edition)EconomicsISBN:9780134078779Author:Karl E. Case, Ray C. Fair, Sharon E. OsterPublisher:PEARSON
 Engineering Economy (17th Edition)EconomicsISBN:9780134870069Author:William G. Sullivan, Elin M. Wicks, C. Patrick KoellingPublisher:PEARSON
 Principles of Economics (MindTap Course List)EconomicsISBN:9781305585126Author:N. Gregory MankiwPublisher:Cengage Learning
 Managerial Economics: A Problem Solving ApproachEconomicsISBN:9781337106665Author:Luke M. Froeb, Brian T. McCann, Michael R. Ward, Mike ShorPublisher:Cengage Learning
 Managerial Economics & Business Strategy (Mcgraw-...EconomicsISBN:9781259290619Author:Michael Baye, Jeff PrincePublisher:McGraw-Hill Education