The following information is from Dessert Dynasty. The company runs three stores and the
December Income Statement for all stores is shown.
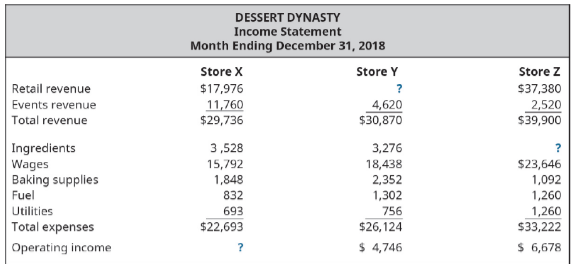
A. Find the missing values for retail revenue, ingredients, and operating income.
B. Comment on the financial performance of each store.
C. Identify a limitation of analyzing the information provided.
You may want to consider using Microsoft Excel or another spreadsheet application for the numerical data.
This information will be used in a subsequent question.
Want to see the full answer?
Check out a sample textbook solutionChapter 9 Solutions
Principles of Accounting Volume 2
Additional Business Textbook Solutions
Managerial Accounting (4th Edition)
Financial Accounting, Student Value Edition (5th Edition)
Principles of Accounting Volume 1
Financial Accounting (11th Edition)
Financial Accounting (12th Edition) (What's New in Accounting)
Financial Accounting, Student Value Edition (4th Edition)
- The following information is from Bluff Run Golf Courses. The company runs three courses and the July income statement for each course is shown. A. Find the missing value for outings revenue, wages, and operating income. B. Comment on the financial performance of each course. C. Identify a limitation of analyzing the information provided. You may want to consider using Microsoft Excel or another spreadsheet application for the numerical data. This information will be used in a subsequent question.arrow_forwardJPL, Inc. has provided its sales and expense data for the most recent period. The Controller has asked you prepare a spreadsheet that shows the related CVP Analysis computations. Use the information included in the Excel Simulation and the Excel functions described below to complete the task. • Cell Reference: Allows you to refer to data from another cell in the worksheet. From the Excel Simulation below, if in a blank cell, =B5" was entered, the formula would output the result from cell B5. or 75 in this example. • Beslc Math functlons: Allows you to use the basic math symbols to perform mathematical functions. You can use the following keys: - (plus sign to add). - (minus sign to subtract). * (asterisk sign to multiply). and / (forward slash to divide). From the Excel Simulation below, if in a blank cell "=85+B6" was entered, the formula would add the values from those cells and output the result, or 120 in this example. If using the other math symbols the result would output an…arrow_forwardRefer to Exhibit 2–3, and answer the following questions.Required:1. List the major differences between the income statements shown for Caterpillar, Inc., Walmart Stores, Inc., and Southwest Airlines Company.2. Explain how cost-accounting data were used to prepare these income statements.3. On the income statement for Southwest Airlines Company, where would the ticket agents’ salaries be shown? Where would the costs of the computer equipment used to keep track of reservations be included on the statement?4. On the income statement for Walmart Stores, Inc., where would the cost of newspaper advertising be shown? How about the cost of merchandise?5. Refer to the income statement for Caterpillar, Inc. Where would the salary of the brand manager who plans advertising for Caterpillar equipment be shown? How about the salary of a production employee? Where would the cost of the raw materials used in the company’s products be included on the statement?arrow_forward
- The Northwest regional manager of Logan Outdoor Equipment Company has conducted a study to determine how her store managers are allocating their time. A study was undertaken over three weeks that collected the following data related to the percentage of time each store manager spent on the tasks of attending required meetings, preparing business reports, customer interaction, and being idle. The results of the data collection appear in the following table: a. Create a stacked-bar chart with locations along the vertical axis. Reformat the bar chart to best display these data by adding axis labels, a chart title, and so on. b. Create a clustered-bar chart with locations along the vertical axis and clusters of tasks. Reformat the bar chart to best display these data by adding axis labels, a chart title, and the like. c. Create multiple bar charts in which each location becomes a single bar chart showing the percentage of time spent on tasks. Reformat the bar charts to best display these data by adding axis labels, a chart title, and so forth. d. Which form of bar chart (stacked, clustered, or multiple) is preferable for these data? Why? e. What can we infer about the differences among how store managers are allocating their time at the different locations?arrow_forward1. Identifying alternative accounting treatments: A new restaurant is opening in one month, and the manager will be holding a one-week intensive training session for new employees. Describe two possible accounting methods for accounting for the costs of training the employees. Codification research is not required for this exercise; your goal on this exercise is just to brainstorm. 2. Identify at least one researchable question for the following issue:A vendor ships goods to a customer on credit but does not have previous credit experience with this customer. 3. Identify at least one researchable question for the following issue:A cable network has just entered into an agreement granting it the right to show reruns of a hit TV series. In exchange for this right, the network must pay the TV show’s creators a fee each time the show airs. 4. The six decision traps and biases are not an all-inclusive list. Perform an Internet search for one other bias that you believe could be applicable…arrow_forwardA five-year earnings summary for Motors, Inc. is presented in the following table. Using this data, construct a single graph of the three earnings measures, and then prepare a memo addressing the following items. What type of graph did you create and why? Present your graphs in your memo. Does there appear to be a relationship among the earnings measures? Explain why or why not. Assess your chart's design in terms of presentation bias. If you feel your chart is free from bias, explain why this is so. Then develop a second chart with the data presented in a manner that might be misleading to a viewer. MOTORS: Earnings Measures, 2008-2012 \table[[Year,2012,2011,2010,2009,200],[\table[[Income],[from],[operations]],5,785,6,450,7,250,6,250,5,975,],[\table[[Net],[income]],4,385,5,300,5,325,4,737,4,529,],[\table[[Net cash],[flow from],[operations]],5,050,8,300,7,700,7,530,5,700,]]arrow_forward
- I need help solving 1,2,4,5,&6 of this problem. I submitted this question earlier and 1 and 2 are incorrect. They said to submit another question for 4,5, and 6, but 1 and 2 were incorrect. Thanks for the help. The financial statements are below, and the question are on the screen shots. Comparative financial statements for Weller Corporation, a merchandising company, for the year ending December 31 appear below. The company did not issue any new common stock during the year. A total of 500,000 shares of common stock were outstanding. The interest rate on the bonds, which were sold at their face value, was 10%. The income tax rate was 40% and the dividend per share of common stock was $0.40 this year. The market value of the company’s common stock at the end of the year was $29. All of the company’s sales are on account. Weller CorporationComparative Balance Sheet(dollars in thousands) This Year Last Year Assets Current assets:…arrow_forwardBe creative. You are a financial accountant for a small business and have been tasked with preparing a monograph for the company's financial statements. The monograph should include a list of economic events that have occurred over the course of one month, including: 1) receivables, 2) merchandising assets, 3) sales, 4) VAT, 5) prepaid expenses and revenues (these five categories have to be in your monograph as mandatory). Your list should include 15 economic events. For each economic event, you will need to create a general journal entry, post the entry to the general ledger, prepare a trial balance, and ultimately prepare the company's income statement and balance sheet. To complete this assignment, you will need to: 1. Create a list of at least 15 economic events that have occurred over the course of one month. Make sure to include the mandatory economic events mentioned above and any other important events that you can think of. 2. For each economic event, create a general journal…arrow_forwardSolar Solutions began operations on January 1, 2015, and is now in its sixth year of operations. It is a retail sales company with a large amount of online sales. The adjusted trial balance as of December 31, 2020 appears below, along with prior year balance sheet data and some additional transaction data for 2020. SOLAR SOLUTIONS Adjusted Trial Balance 12/31/2020 2020 2019 Account Title Adjusted Trial Balance Post-Closing Trial Balance Debit Credit Debit Credit Cash $ 122,200 55,000 125,600 Accounts Receivable 35,000 Prepaid Insurance 5,000 6,000 |Inventory Office Equipment Machinery & Tools Accumulated Depreciation Accounts Payable Salaries Payable Sales Tax Payable Note Payable-Long Term Common Stock, $10 par 46,000 15,600 63,000 47,000 59,000 21,000 21,000 16,000 11,200 16,800 2,600 2,700 2,000 4,000 31,000 22,100 240,000 160,000 Retained Earnings 28,600 28,600 Dividends 10,000 Sales Revenue Cost of Goods Sold Rent Expense Salaries Expense 235,000 127,600 20,000 36,000 Insurance…arrow_forward
- Mischief, Inc., is a regional pet toy supplier that tracks its business sales in a spreadsheet. The owner, Lisa Derrick, has provided you with a skeleton worksheet, T2_TotalMischief_ Data.xls, with the totals for each quarter by sales region. Lisa needs you to total each column and row, and then provide her with a clustered column chart of each region by quarter. See Figure T2.21 for a sample of what Lisa would like you to do. Regional Sales Summary 1st Quarter 2nd Quarter 3rd Quarter 4th Quarter Totals Northeast $ 119,700.00 $ 125,100.00 $ 133,400.00 $ 139,500.00 South $ 48,900.00 $ 52,000.00 $ 49,600.00 $ 54,500.00 Midwest $ 34,600.00 $ 32,200.00 $ 47,000.00 $ 45,900.00 West $ 56,200.00 $ 49,000.00 $ 52,000.00 $ 51,300.00 Totalsarrow_forwardFor the transaction below, determine which QuickBooks Online task is the most appropriate to record it. Select a task from the drop down list. Apr. 4: Purchase office supplies from The Office Store, for cash, $900. Review the source documents before answering. The most appropriate QuickBooks task isarrow_forwardThe general ledger of Jay Consulting shows the following balances at July 31: Jay has asked you to develop a worksheet that will serve as a trial balance (file name PTB). Use the data provided as input for your model. Review the Model-Building Problem Checklist on page 154 to ensure that your worksheet is complete. Print the worksheet when done. Check figure: Total debits, 17,731. To test your model, use the following balances at August 31: Print the worksheet when done. Check figure: Total debits, 18,810. CHART (optional) Using the test data worksheet, prepare a pie chart showing the percentage of each asset to total assets. Print the chart when done.arrow_forward
- Principles of Accounting Volume 2AccountingISBN:9781947172609Author:OpenStaxPublisher:OpenStax CollegeExcel Applications for Accounting PrinciplesAccountingISBN:9781111581565Author:Gaylord N. SmithPublisher:Cengage LearningCollege Accounting (Book Only): A Career ApproachAccountingISBN:9781337280570Author:Scott, Cathy J.Publisher:South-Western College Pub
- Century 21 Accounting Multicolumn JournalAccountingISBN:9781337679503Author:GilbertsonPublisher:CengageEssentials of Business Analytics (MindTap Course ...StatisticsISBN:9781305627734Author:Jeffrey D. Camm, James J. Cochran, Michael J. Fry, Jeffrey W. Ohlmann, David R. AndersonPublisher:Cengage Learning