
Pearson eText for Essentials of Statistics -- Instant Access (Pearson+)
6th Edition
ISBN: 9780137517374
Author: Mario Triola
Publisher: PEARSON+
expand_more
expand_more
format_list_bulleted
Concept explainers
Videos
Textbook Question
Chapter 9, Problem 2CRE
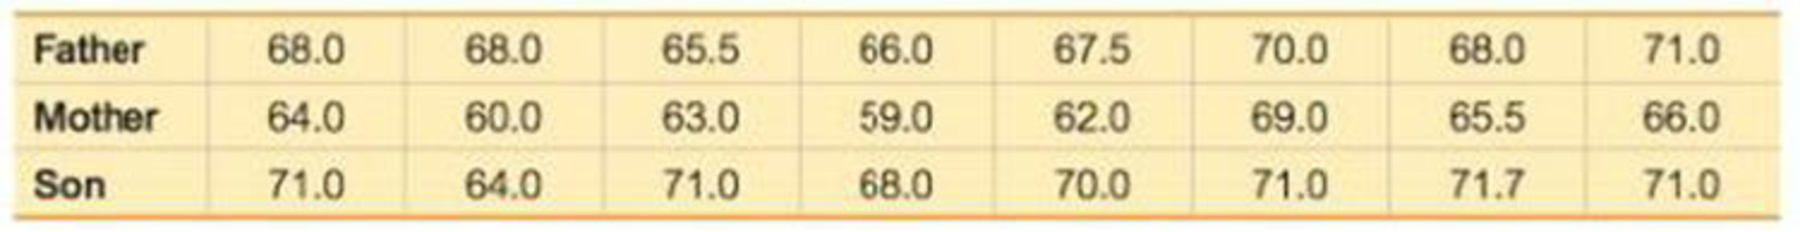
Family Heights. In Exercises 1–5, use the following heights (in.) The data are matched so that each column consists of heights from the same family.
Expert Solution & Answer
Want to see the full answer?
Check out a sample textbook solution
Students have asked these similar questions
7. In a 2011 article, M. Radelet and G. Pierce reported a logistic prediction equation
for the death penalty verdicts in North Carolina. Let Y denote whether a subject
convicted of murder received the death penalty (1=yes), for the defendant's race
h (h1, black; h = 2, white), victim's race i (i = 1, black; i = 2, white), and
number of additional factors j (j = 0, 1, 2). For the model
logit[P(Y = 1)] = a + ß₁₂ + By + B²²,
they reported = -5.26, D
â
BD
=
0, BD
=
0.17, BY = 0, BY
=
0.91, B = 0,
B = 2.02, B = 3.98.
(a) Estimate the probability of receiving the death penalty for the group most
likely to receive it. [4 pts]
(b) If, instead, parameters used constraints 3D = BY = 35 = 0, report the esti-
mates. [3 pts]
h
(c) If, instead, parameters used constraints Σ₁ = Σ₁ BY = Σ; B = 0, report
the estimates. [3 pts]
Hint the probabilities, odds and odds ratios do not change with constraints.
Solve please and thank you!
Solve please and thank you!
Chapter 9 Solutions
Pearson eText for Essentials of Statistics -- Instant Access (Pearson+)
Ch. 9.1 - Verifying Requirements In the largest clinical...Ch. 9.1 - Verifying Requirements In the largest clinical...Ch. 9.1 - Hypotheses and Conclusions Refer to the hypothesis...Ch. 9.1 - Using Confidence Intervals a. Assume that we want...Ch. 9.1 - Interpreting Displays. In Exercises 5 and 6, use...Ch. 9.1 - Treating Carpal Tunnel Syndrome Carpal tunnel...Ch. 9.1 - Testing Claims About Proportions. In Exercises...Ch. 9.1 - Accuracy of Fast Food Drive-Through Orders In a...Ch. 9.1 - Testing Claims About Proportions. In Exercises...Ch. 9.1 - Testing Claims About Proportions. In Exercises...
Ch. 9.1 - Testing Claims About Proportions. In Exercises...Ch. 9.1 - Testing Claims About Proportions. In Exercises...Ch. 9.1 - Testing Claims About Proportions. In Exercises...Ch. 9.1 - Testing Claims About Proportions. In Exercises...Ch. 9.1 - Testing Claims About Proportions. In Exercises...Ch. 9.1 - Prob. 16BSCCh. 9.1 - Testing Claims About Proportions. In Exercises...Ch. 9.1 - Testing Claims About Proportions. In Exercises...Ch. 9.1 - Testing Claims About Proportions. In Exercises...Ch. 9.1 - Testing Claims About Proportions. In Exercises...Ch. 9.1 - Testing Claims About Proportions. In Exercises...Ch. 9.1 - Testing Claims About Proportions. In Exercises...Ch. 9.1 - Prob. 23BBCh. 9.1 - Yawning and Fishers Exact Test In one segment of...Ch. 9.1 - Overlap of Confidence Intervals In the article On...Ch. 9.1 - Equivalence of Hypothesis Test and Confidence...Ch. 9.2 - Independent and Dependent Samples Which of the...Ch. 9.2 - Confidence Interval for Hemoglobin Large samples...Ch. 9.2 - Hypothesis Tests and Confidence Intervals for...Ch. 9.2 - Degrees of Freedom For Example 1 on page 431, we...Ch. 9.2 - In Exercises 520, assume that the two samples are...Ch. 9.2 - In Exercises 520, assume that the two samples are...Ch. 9.2 - In Exercises 520, assume that the two samples are...Ch. 9.2 - In Exercises 520, assume that the two samples are...Ch. 9.2 - In Exercises 520, assume that the two samples are...Ch. 9.2 - In Exercises 520, assume that the two samples are...Ch. 9.2 - In Exercises 520, assume that the two samples are...Ch. 9.2 - In Exercises 520, assume that the two samples are...Ch. 9.2 - In Exercises 520, assume that the two samples are...Ch. 9.2 - In Exercises 520, assume that the two samples are...Ch. 9.2 - In Exercises 520, assume that the two samples are...Ch. 9.2 - In Exercises 520, assume that the two samples are...Ch. 9.2 - In Exercises 520, assume that the two samples are...Ch. 9.2 - In Exercises 520, assume that the two samples are...Ch. 9.2 - In Exercises 520, assume that the two samples are...Ch. 9.2 - In Exercises 520, assume that the two samples are...Ch. 9.2 - Pooling Repeat Exercise 12 IQ and Lead by assuming...Ch. 9.2 - Degrees of Freedom In Exercise 20 Blanking Out on...Ch. 9.2 - No Variation in a Sample An experiment was...Ch. 9.3 - True? For the methods of this section, which of...Ch. 9.3 - Notation Listed below are body temperatures from...Ch. 9.3 - Units of Measure If the values listed in Exercise...Ch. 9.3 - Degrees of Freedom If we use the sample data in...Ch. 9.3 - In Exercises 516, use the listed paired sample...Ch. 9.3 - In Exercises 516, use the listed paired sample...Ch. 9.3 - In Exercises 516, use the listed paired sample...Ch. 9.3 - In Exercises 516, use the listed paired sample...Ch. 9.3 - In Exercises 516, use the listed paired sample...Ch. 9.3 - In Exercises 516, use the listed paired sample...Ch. 9.3 - Prob. 11BSCCh. 9.3 - Prob. 12BSCCh. 9.3 - In Exercises 516, use the listed paired sample...Ch. 9.3 - In Exercises 516, use the listed paired sample...Ch. 9.3 - In Exercises 516, use the listed paired sample...Ch. 9.3 - In Exercises 516, use the listed paired sample...Ch. 9 - In Exercises 15, use the following survey results:...Ch. 9 - In Exercises 1-5, use the following survey...Ch. 9 - In Exercises 1-5, use the following survey...Ch. 9 - In Exercises 1-5, use the following survey...Ch. 9 - In Exercises 7-5, use the following survey...Ch. 9 - True? Determine whether the following statement is...Ch. 9 - True? When we collect random samples to test the...Ch. 9 - Dependent or Independent? Listed below are...Ch. 9 - Hypotheses Identify the null and alternative...Ch. 9 - Test Statistics Identify the test statistic that...Ch. 9 - Denomination Effect In the article The...Ch. 9 - Denomination Effect Construct the confidence...Ch. 9 - Heights Listed below are heights (cm) randomly...Ch. 9 - Heights Use a 0.01 significance level with the...Ch. 9 - Before /After Treatment Results Captopril is a...Ch. 9 - Eyewitness Accuracy of Police Does stress affect...Ch. 9 - Are Flights Cheaper When Scheduled Earlier? Listed...Ch. 9 - Family Heights. In Exercises 15, use the following...Ch. 9 - Scatterplot Construct a scatterplot of the...Ch. 9 - Family Heights. In Exercises 1-5, use the...Ch. 9 - Family Heights. In Exercises 1-5, use the...Ch. 9 - Assessing Normality Interpret the normal quantile...Ch. 9 - Braking Reaction Times: Histogram Listed below are...Ch. 9 - Braking Reaction Times: Normal? The accompanying...Ch. 9 - Braking Reaction Times: Boxplots Use the same data...Ch. 9 - In Exercises 5-20, assume that the two samples are...Ch. 9 - Braking Reaction Times: Confidence Intervals a....Ch. 9 - FROM DATA TO DECISION Critical Thinking: Did the...Ch. 9 - Critical Thinking: Did the NFL Rule Change Have...Ch. 9 - Critical Thinking: Did the NFL Rule Change Have...
Knowledge Booster


Learn more about
Need a deep-dive on the concept behind this application? Look no further. Learn more about this topic, statistics and related others by exploring similar questions and additional content below.Similar questions
- Question 1:We want to evaluate the impact on the monetary economy for a company of two types of strategy (competitive strategy, cooperative strategy) adopted by buyers.Competitive strategy: strategy characterized by firm behavior aimed at obtaining concessions from the buyer.Cooperative strategy: a strategy based on a problem-solving negotiating attitude, with a high level of trust and cooperation.A random sample of 17 buyers took part in a negotiation experiment in which 9 buyers adopted the competitive strategy, and the other 8 the cooperative strategy. The savings obtained for each group of buyers are presented in the pdf that i sent: For this problem, we assume that the samples are random and come from two normal populations of unknown but equal variances.According to the theory, the average saving of buyers adopting a competitive strategy will be lower than that of buyers adopting a cooperative strategy.a) Specify the population identifications and the hypotheses H0 and H1…arrow_forwardYou assume that the annual incomes for certain workers are normal with a mean of $28,500 and a standard deviation of $2,400. What’s the chance that a randomly selected employee makes more than $30,000?What’s the chance that 36 randomly selected employees make more than $30,000, on average?arrow_forwardWhat’s the chance that a fair coin comes up heads more than 60 times when you toss it 100 times?arrow_forward
- Suppose that you have a normal population of quiz scores with mean 40 and standard deviation 10. Select a random sample of 40. What’s the chance that the mean of the quiz scores won’t exceed 45?Select one individual from the population. What’s the chance that his/her quiz score won’t exceed 45?arrow_forwardSuppose that you take a sample of 100 from a population that contains 45 percent Democrats. What sample size condition do you need to check here (if any)?What’s the standard error of ^P?Compare the standard errors of ^p n=100 for ,n=1000 , n=10,000, and comment.arrow_forwardSuppose that a class’s test scores have a mean of 80 and standard deviation of 5. You choose 25 students from the class. What’s the chance that the group’s average test score is more than 82?arrow_forward
- Suppose that you collect data on 10 products and check their weights. The average should be 10 ounces, but your sample mean is 9 ounces with standard deviation 2 ounces. Find the standard score.What percentile is the standard score found in part a of this question closest to?Suppose that the mean really is 10 ounces. Do you find these results unusual? Use probabilities to explain.arrow_forwardSuppose that you want to sample expensive computer chips, but you can have only n=3 of them. Should you continue the experiment?arrow_forwardSuppose that studies claim that 40 percent of cellphone owners use their phones in the car while driving. What’s the chance that more than 425 out of a random sample of 1,000 cellphone owners say they use their phones while driving?arrow_forward
- Suppose that the average length of stay in Europe for American tourists is 17 days, with standard deviation 4.5. You choose a random sample of 16 American tourists. The sample of 16 stay an average of 18.5 days or more. What’s the chance of that happening?arrow_forwardHow do you recognize that a statistical problem requires you to use the CLT? Think of one or two clues you can look for. (Assume quantitative data.)arrow_forwardSuppose that you take a sample of 100 from a skewed population with mean 50 and standard deviation 15. What sample size condition do you need to check here (if any)?What’s the shape and center of the sampling distribution for ?What’s the standard error?arrow_forward
arrow_back_ios
SEE MORE QUESTIONS
arrow_forward_ios
Recommended textbooks for you
 Glencoe Algebra 1, Student Edition, 9780079039897...AlgebraISBN:9780079039897Author:CarterPublisher:McGraw Hill
 Big Ideas Math A Bridge To Success Algebra 1: Stu...AlgebraISBN:9781680331141Author:HOUGHTON MIFFLIN HARCOURTPublisher:Houghton Mifflin Harcourt
 Holt Mcdougal Larson Pre-algebra: Student Edition...AlgebraISBN:9780547587776Author:HOLT MCDOUGALPublisher:HOLT MCDOUGAL
 Algebra: Structure And Method, Book 1AlgebraISBN:9780395977224Author:Richard G. Brown, Mary P. Dolciani, Robert H. Sorgenfrey, William L. ColePublisher:McDougal Littell
Glencoe Algebra 1, Student Edition, 9780079039897...
Algebra
ISBN:9780079039897
Author:Carter
Publisher:McGraw Hill
Big Ideas Math A Bridge To Success Algebra 1: Stu...
Algebra
ISBN:9781680331141
Author:HOUGHTON MIFFLIN HARCOURT
Publisher:Houghton Mifflin Harcourt
Holt Mcdougal Larson Pre-algebra: Student Edition...
Algebra
ISBN:9780547587776
Author:HOLT MCDOUGAL
Publisher:HOLT MCDOUGAL
Algebra: Structure And Method, Book 1
Algebra
ISBN:9780395977224
Author:Richard G. Brown, Mary P. Dolciani, Robert H. Sorgenfrey, William L. Cole
Publisher:McDougal Littell
The Shape of Data: Distributions: Crash Course Statistics #7; Author: CrashCourse;https://www.youtube.com/watch?v=bPFNxD3Yg6U;License: Standard YouTube License, CC-BY
Shape, Center, and Spread - Module 20.2 (Part 1); Author: Mrmathblog;https://www.youtube.com/watch?v=COaid7O_Gag;License: Standard YouTube License, CC-BY
Shape, Center and Spread; Author: Emily Murdock;https://www.youtube.com/watch?v=_YyW0DSCzpM;License: Standard Youtube License