
Pearson eText for Essentials of Statistics -- Instant Access (Pearson+)
6th Edition
ISBN: 9780137517374
Author: Mario Triola
Publisher: PEARSON+
expand_more
expand_more
format_list_bulleted
Concept explainers
Videos
Textbook Question
Chapter 9.1, Problem 5BSC
Interpreting Displays. In Exercises 5 and 6, use the results from the given displays.
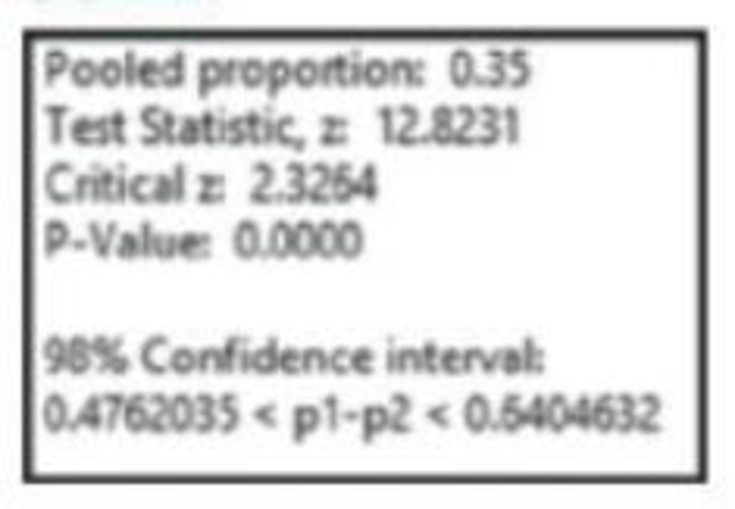
5. Testing Laboratory Gloves The New York Times published an article about a study in which Professor Denise Korniewicz and other Johns Hopkins researchers subjected laboratory gloves to stress. Among 240 vinyl gloves, 63% leaked viruses. Among 240 latex gloves, 7% leaked viruses. See the accompanying display of the Statdisk results. Using a 0.01 significance level, test the claim that vinyl gloves have a greater virus leak rate than latex gloves.
Statdisk
Expert Solution & Answer
Want to see the full answer?
Check out a sample textbook solution
Students have asked these similar questions
A retail store manager claims that the average daily sales of the store are $1,500.
You aim to test whether the actual average daily sales differ significantly from this claimed value.
You can provide your answer by inserting a text box and the answer must include:
Null hypothesis,
Alternative hypothesis,
Show answer (output table/summary table), and
Conclusion based on the P value.
Showing the calculation is a must. If calculation is missing,so please provide a step by step on the answers
Numerical answers in the yellow cells
Show all work
Show all work
Chapter 9 Solutions
Pearson eText for Essentials of Statistics -- Instant Access (Pearson+)
Ch. 9.1 - Verifying Requirements In the largest clinical...Ch. 9.1 - Verifying Requirements In the largest clinical...Ch. 9.1 - Hypotheses and Conclusions Refer to the hypothesis...Ch. 9.1 - Using Confidence Intervals a. Assume that we want...Ch. 9.1 - Interpreting Displays. In Exercises 5 and 6, use...Ch. 9.1 - Treating Carpal Tunnel Syndrome Carpal tunnel...Ch. 9.1 - Testing Claims About Proportions. In Exercises...Ch. 9.1 - Accuracy of Fast Food Drive-Through Orders In a...Ch. 9.1 - Testing Claims About Proportions. In Exercises...Ch. 9.1 - Testing Claims About Proportions. In Exercises...
Ch. 9.1 - Testing Claims About Proportions. In Exercises...Ch. 9.1 - Testing Claims About Proportions. In Exercises...Ch. 9.1 - Testing Claims About Proportions. In Exercises...Ch. 9.1 - Testing Claims About Proportions. In Exercises...Ch. 9.1 - Testing Claims About Proportions. In Exercises...Ch. 9.1 - Prob. 16BSCCh. 9.1 - Testing Claims About Proportions. In Exercises...Ch. 9.1 - Testing Claims About Proportions. In Exercises...Ch. 9.1 - Testing Claims About Proportions. In Exercises...Ch. 9.1 - Testing Claims About Proportions. In Exercises...Ch. 9.1 - Testing Claims About Proportions. In Exercises...Ch. 9.1 - Testing Claims About Proportions. In Exercises...Ch. 9.1 - Prob. 23BBCh. 9.1 - Yawning and Fishers Exact Test In one segment of...Ch. 9.1 - Overlap of Confidence Intervals In the article On...Ch. 9.1 - Equivalence of Hypothesis Test and Confidence...Ch. 9.2 - Independent and Dependent Samples Which of the...Ch. 9.2 - Confidence Interval for Hemoglobin Large samples...Ch. 9.2 - Hypothesis Tests and Confidence Intervals for...Ch. 9.2 - Degrees of Freedom For Example 1 on page 431, we...Ch. 9.2 - In Exercises 520, assume that the two samples are...Ch. 9.2 - In Exercises 520, assume that the two samples are...Ch. 9.2 - In Exercises 520, assume that the two samples are...Ch. 9.2 - In Exercises 520, assume that the two samples are...Ch. 9.2 - In Exercises 520, assume that the two samples are...Ch. 9.2 - In Exercises 520, assume that the two samples are...Ch. 9.2 - In Exercises 520, assume that the two samples are...Ch. 9.2 - In Exercises 520, assume that the two samples are...Ch. 9.2 - In Exercises 520, assume that the two samples are...Ch. 9.2 - In Exercises 520, assume that the two samples are...Ch. 9.2 - In Exercises 520, assume that the two samples are...Ch. 9.2 - In Exercises 520, assume that the two samples are...Ch. 9.2 - In Exercises 520, assume that the two samples are...Ch. 9.2 - In Exercises 520, assume that the two samples are...Ch. 9.2 - In Exercises 520, assume that the two samples are...Ch. 9.2 - In Exercises 520, assume that the two samples are...Ch. 9.2 - Pooling Repeat Exercise 12 IQ and Lead by assuming...Ch. 9.2 - Degrees of Freedom In Exercise 20 Blanking Out on...Ch. 9.2 - No Variation in a Sample An experiment was...Ch. 9.3 - True? For the methods of this section, which of...Ch. 9.3 - Notation Listed below are body temperatures from...Ch. 9.3 - Units of Measure If the values listed in Exercise...Ch. 9.3 - Degrees of Freedom If we use the sample data in...Ch. 9.3 - In Exercises 516, use the listed paired sample...Ch. 9.3 - In Exercises 516, use the listed paired sample...Ch. 9.3 - In Exercises 516, use the listed paired sample...Ch. 9.3 - In Exercises 516, use the listed paired sample...Ch. 9.3 - In Exercises 516, use the listed paired sample...Ch. 9.3 - In Exercises 516, use the listed paired sample...Ch. 9.3 - Prob. 11BSCCh. 9.3 - Prob. 12BSCCh. 9.3 - In Exercises 516, use the listed paired sample...Ch. 9.3 - In Exercises 516, use the listed paired sample...Ch. 9.3 - In Exercises 516, use the listed paired sample...Ch. 9.3 - In Exercises 516, use the listed paired sample...Ch. 9 - In Exercises 15, use the following survey results:...Ch. 9 - In Exercises 1-5, use the following survey...Ch. 9 - In Exercises 1-5, use the following survey...Ch. 9 - In Exercises 1-5, use the following survey...Ch. 9 - In Exercises 7-5, use the following survey...Ch. 9 - True? Determine whether the following statement is...Ch. 9 - True? When we collect random samples to test the...Ch. 9 - Dependent or Independent? Listed below are...Ch. 9 - Hypotheses Identify the null and alternative...Ch. 9 - Test Statistics Identify the test statistic that...Ch. 9 - Denomination Effect In the article The...Ch. 9 - Denomination Effect Construct the confidence...Ch. 9 - Heights Listed below are heights (cm) randomly...Ch. 9 - Heights Use a 0.01 significance level with the...Ch. 9 - Before /After Treatment Results Captopril is a...Ch. 9 - Eyewitness Accuracy of Police Does stress affect...Ch. 9 - Are Flights Cheaper When Scheduled Earlier? Listed...Ch. 9 - Family Heights. In Exercises 15, use the following...Ch. 9 - Scatterplot Construct a scatterplot of the...Ch. 9 - Family Heights. In Exercises 1-5, use the...Ch. 9 - Family Heights. In Exercises 1-5, use the...Ch. 9 - Assessing Normality Interpret the normal quantile...Ch. 9 - Braking Reaction Times: Histogram Listed below are...Ch. 9 - Braking Reaction Times: Normal? The accompanying...Ch. 9 - Braking Reaction Times: Boxplots Use the same data...Ch. 9 - In Exercises 5-20, assume that the two samples are...Ch. 9 - Braking Reaction Times: Confidence Intervals a....Ch. 9 - FROM DATA TO DECISION Critical Thinking: Did the...Ch. 9 - Critical Thinking: Did the NFL Rule Change Have...Ch. 9 - Critical Thinking: Did the NFL Rule Change Have...
Knowledge Booster


Learn more about
Need a deep-dive on the concept behind this application? Look no further. Learn more about this topic, statistics and related others by exploring similar questions and additional content below.Similar questions
- please find the answers for the yellows boxes using the information and the picture belowarrow_forwardA marketing agency wants to determine whether different advertising platforms generate significantly different levels of customer engagement. The agency measures the average number of daily clicks on ads for three platforms: Social Media, Search Engines, and Email Campaigns. The agency collects data on daily clicks for each platform over a 10-day period and wants to test whether there is a statistically significant difference in the mean number of daily clicks among these platforms. Conduct ANOVA test. You can provide your answer by inserting a text box and the answer must include: also please provide a step by on getting the answers in excel Null hypothesis, Alternative hypothesis, Show answer (output table/summary table), and Conclusion based on the P value.arrow_forwardA company found that the daily sales revenue of its flagship product follows a normal distribution with a mean of $4500 and a standard deviation of $450. The company defines a "high-sales day" that is, any day with sales exceeding $4800. please provide a step by step on how to get the answers Q: What percentage of days can the company expect to have "high-sales days" or sales greater than $4800? Q: What is the sales revenue threshold for the bottom 10% of days? (please note that 10% refers to the probability/area under bell curve towards the lower tail of bell curve) Provide answers in the yellow cellsarrow_forward
- Business Discussarrow_forwardThe following data represent total ventilation measured in liters of air per minute per square meter of body area for two independent (and randomly chosen) samples. Analyze these data using the appropriate non-parametric hypothesis testarrow_forwardeach column represents before & after measurements on the same individual. Analyze with the appropriate non-parametric hypothesis test for a paired design.arrow_forward
arrow_back_ios
SEE MORE QUESTIONS
arrow_forward_ios
Recommended textbooks for you
 College Algebra (MindTap Course List)AlgebraISBN:9781305652231Author:R. David Gustafson, Jeff HughesPublisher:Cengage Learning
 Glencoe Algebra 1, Student Edition, 9780079039897...AlgebraISBN:9780079039897Author:CarterPublisher:McGraw Hill
 Holt Mcdougal Larson Pre-algebra: Student Edition...AlgebraISBN:9780547587776Author:HOLT MCDOUGALPublisher:HOLT MCDOUGAL
 Big Ideas Math A Bridge To Success Algebra 1: Stu...AlgebraISBN:9781680331141Author:HOUGHTON MIFFLIN HARCOURTPublisher:Houghton Mifflin Harcourt
College Algebra (MindTap Course List)
Algebra
ISBN:9781305652231
Author:R. David Gustafson, Jeff Hughes
Publisher:Cengage Learning
Glencoe Algebra 1, Student Edition, 9780079039897...
Algebra
ISBN:9780079039897
Author:Carter
Publisher:McGraw Hill
Holt Mcdougal Larson Pre-algebra: Student Edition...
Algebra
ISBN:9780547587776
Author:HOLT MCDOUGAL
Publisher:HOLT MCDOUGAL
Big Ideas Math A Bridge To Success Algebra 1: Stu...
Algebra
ISBN:9781680331141
Author:HOUGHTON MIFFLIN HARCOURT
Publisher:Houghton Mifflin Harcourt
Bayes' Theorem 1: Introduction and conditional probability; Author: Dr Nic's Maths and Stats;https://www.youtube.com/watch?v=lQVkXfJ-rpU;License: Standard YouTube License, CC-BY
What is Conditional Probability | Bayes Theorem | Conditional Probability Examples & Problems; Author: ACADGILD;https://www.youtube.com/watch?v=MxOny_1y2Q4;License: Standard YouTube License, CC-BY
Bayes' Theorem of Probability With Tree Diagrams & Venn Diagrams; Author: The Organic Chemistry Tutor;https://www.youtube.com/watch?v=OByl4RJxnKA;License: Standard YouTube License, CC-BY
Bayes' Theorem - The Simplest Case; Author: Dr. Trefor Bazett;https://www.youtube.com/watch?v=XQoLVl31ZfQ;License: Standard Youtube License