
Concept explainers
Videos
Ethical Behavior of Business Students at Bayview University
During the global recession of 2008 and 2009, there were many accusations of unethical behavior by Wall Street executives, financial managers, and other corporate officers. At that time, an article appeared that suggested that part of the reason for such unethical business behavior may stem from the fact that cheating has become more prevalent among business students (Chronicle of Higher Education, February 10, 2009). The article reported that 56% of business students admitted to cheating at some time during their academic career as compared to 47% of nonbusiness students.
Cheating has been a concern of the dean of the College of Business at Bayview University for several years. Some faculty members in the college believe that cheating is more widespread at Bayview than at other universities, while other faculty members think that cheating is not a major problem in the college. To resolve some of these issues, the dean commissioned a study to assess the current ethical behavior of business students at Bay-view. As part of this study, an anonymous exit survey was administered to a sample of 90 business students from this year’s graduating class. Responses to the following questions were used to obtain data regarding three types of cheating.
During your time at Bayview, did you ever present work copied off the Internet as your own?
Yes ______ No ______
During your time at Bayview, did you ever copy answers off another student’s exam?
Yes ________ No _______
During your time at Bayview, did you ever collaborate with other students on projects that were supposed to be completed individually?
Yes ________ No _______
Any student who answered Yes to one or more of these questions was considered to have been involved in some type of cheating. A portion of the data collected follows. The complete data set is in the file named Bayview.
| Student | Copied from Internet | Copied on Exam | Collaborated on Individual project | Gender |
| 1 | No | No | No | Female |
| 2 | No | No | No | Male |
| 3 | Yes | No | Yes | Male |
| 4 | Yes | Yes | No | Male |
| 5 | No | No | Yes | Male |
| 6 | Yes | No | No | Female |
| . | . | . | . | . |
| . | . | . | . | . |
| 88 | No | No | No | Male |
| 89 | No | Yes | Yes | Male |
| 90 | No | No | No | Female |
Managerial Report
Prepare a report for the dean of the college that summarizes your assessment of the nature of cheating by business students at Bayview University. Be sure to include the following items in your report.
- 1. Use
descriptive statistics to summarize the data and comment on your findings. - 2. Develop 95% confidence intervals for the proportion of all students, the proportion of male students, and the proportion of female students who were involved in some type of cheating.
- 3. Conduct a hypothesis test to determine if the proportion of business students at Bayview University who were involved in some type of cheating is less than that of business students at other institutions as reported by the Chronicle of Higher Education.
- 4. Conduct a hypothesis test to determine if the proportion of business students at Bay-view University who were involved in some form of cheating is less than that of non-business students at other institutions as reported by the Chronicle of higher Education.
- 5. What advice would you give to the dean based upon your analysis of the data?
1.
Summarize the data and comment on your findings using the descriptive statistics.
Answer to Problem 2CP
The percentage of males is greater in Copied from Internet, Copied on Exam, and Collaborated on Individual Project compared to females.
Explanation of Solution
Calculation:
The given data is based on the assessment of the nature of cheating by a business student at Bayview University.
Software procedure:
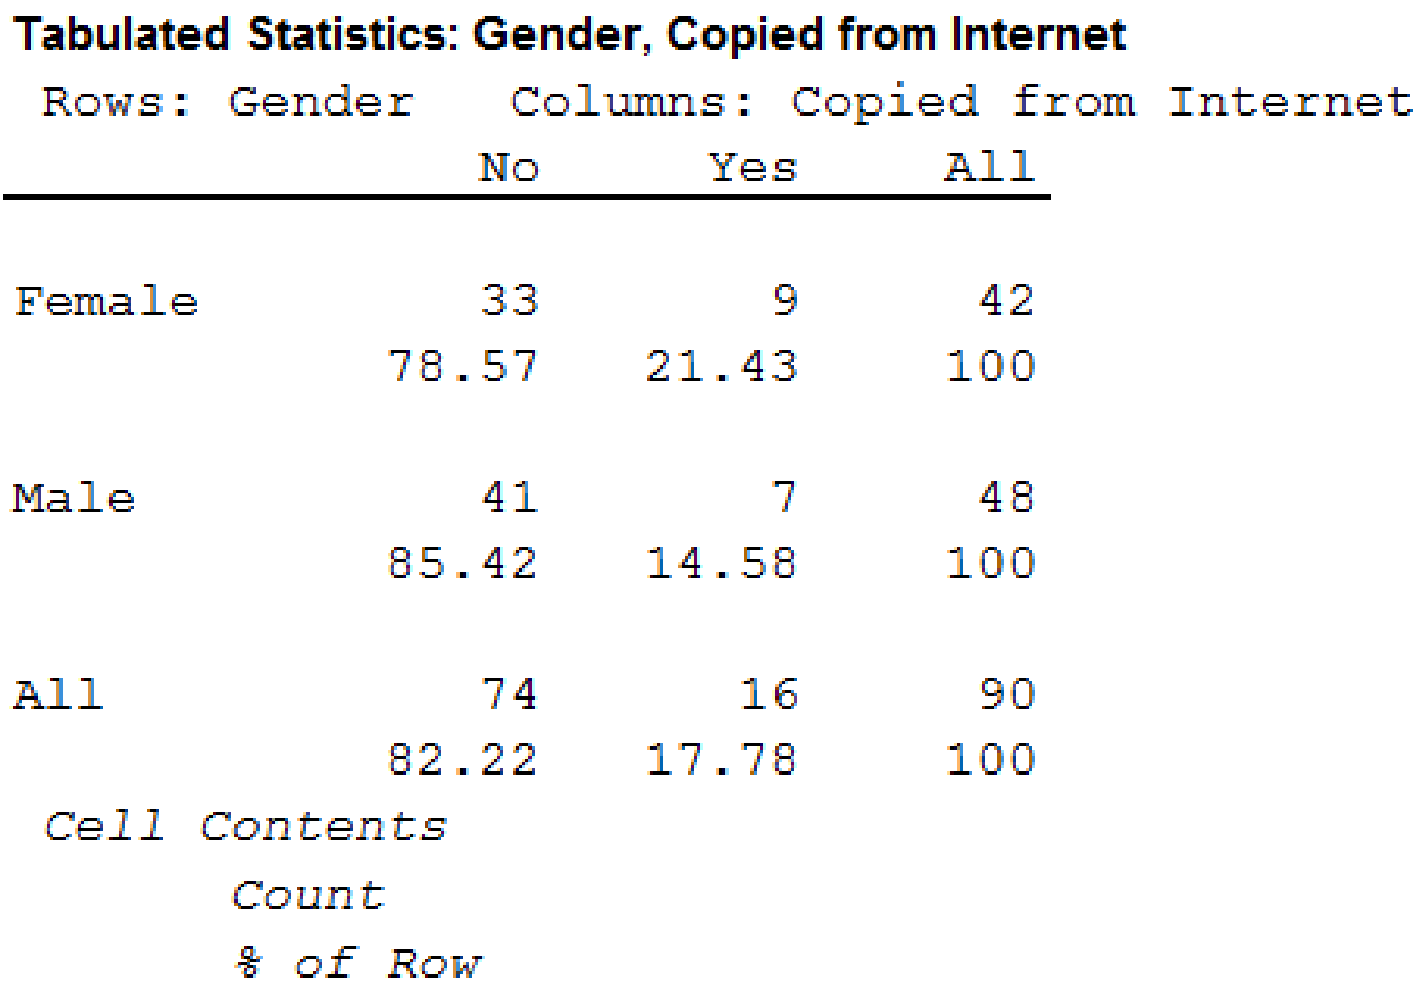
A step-by-step procedure to construct a contingency table or cross table for gender and Copied from Internet using MINITAB software given below:
- Choose stat > tables>cross tabulation and chi square.
- Choose raw data (summarized).
- In rows, enter the column of Gender.
- In columns, enter the column of Copied from Internet.
- Under display, select count
- Click OK
Output using MINITAB software is given below:
Software procedure:
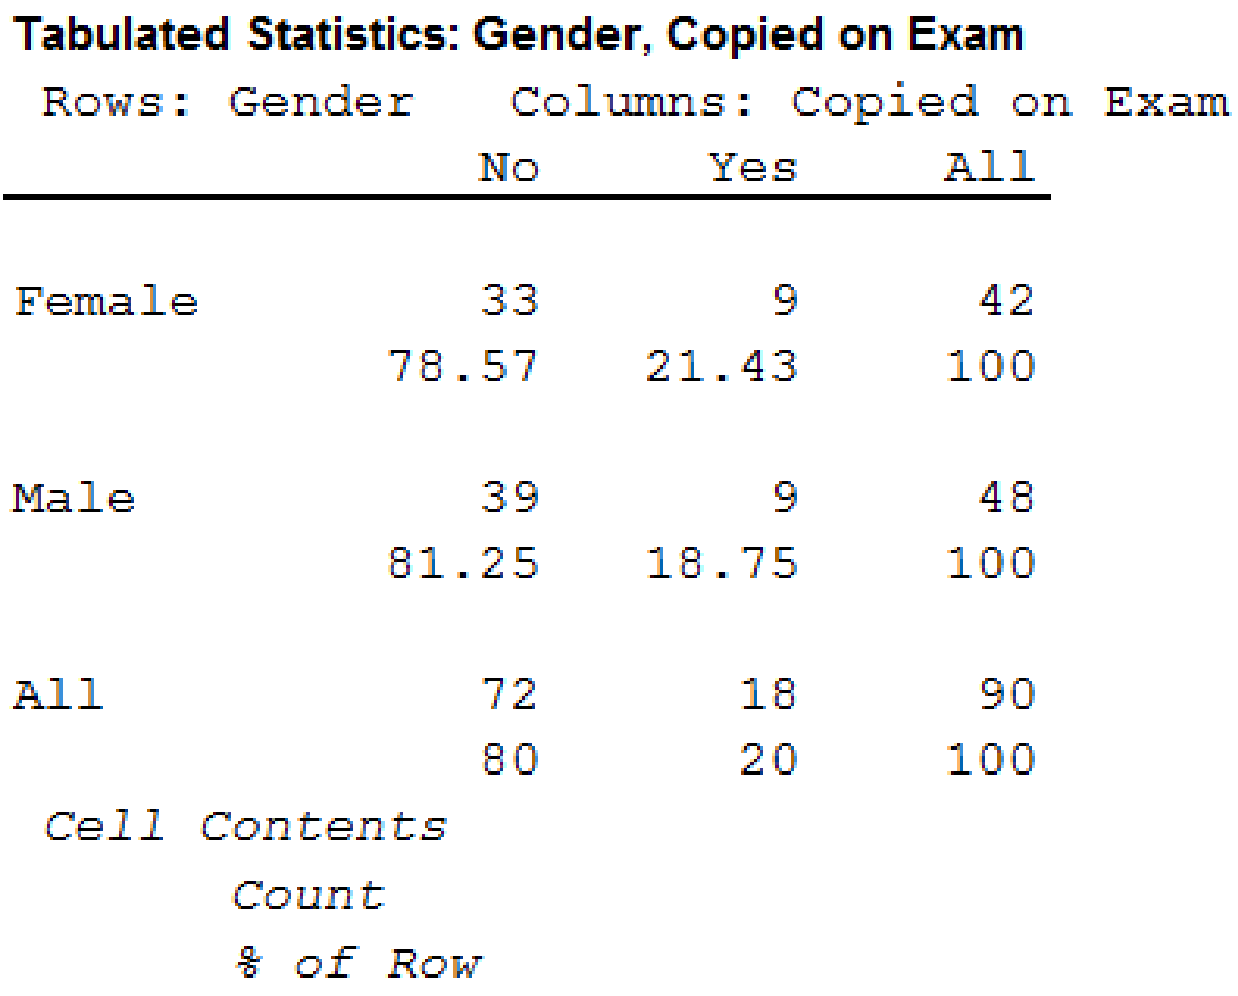
A step-by-step procedure to construct a contingency table or cross table for gender and Copied on Exam using MINITAB software given below:
- Choose stat > tables>cross tabulation and chi square.
- Choose raw data (summarized).
- In rows, enter the column of Gender.
- In columns, enter the column of Copied on Exam.
- Under display, select count
- Click OK
Output using MINITAB software is given below:
Software procedure:
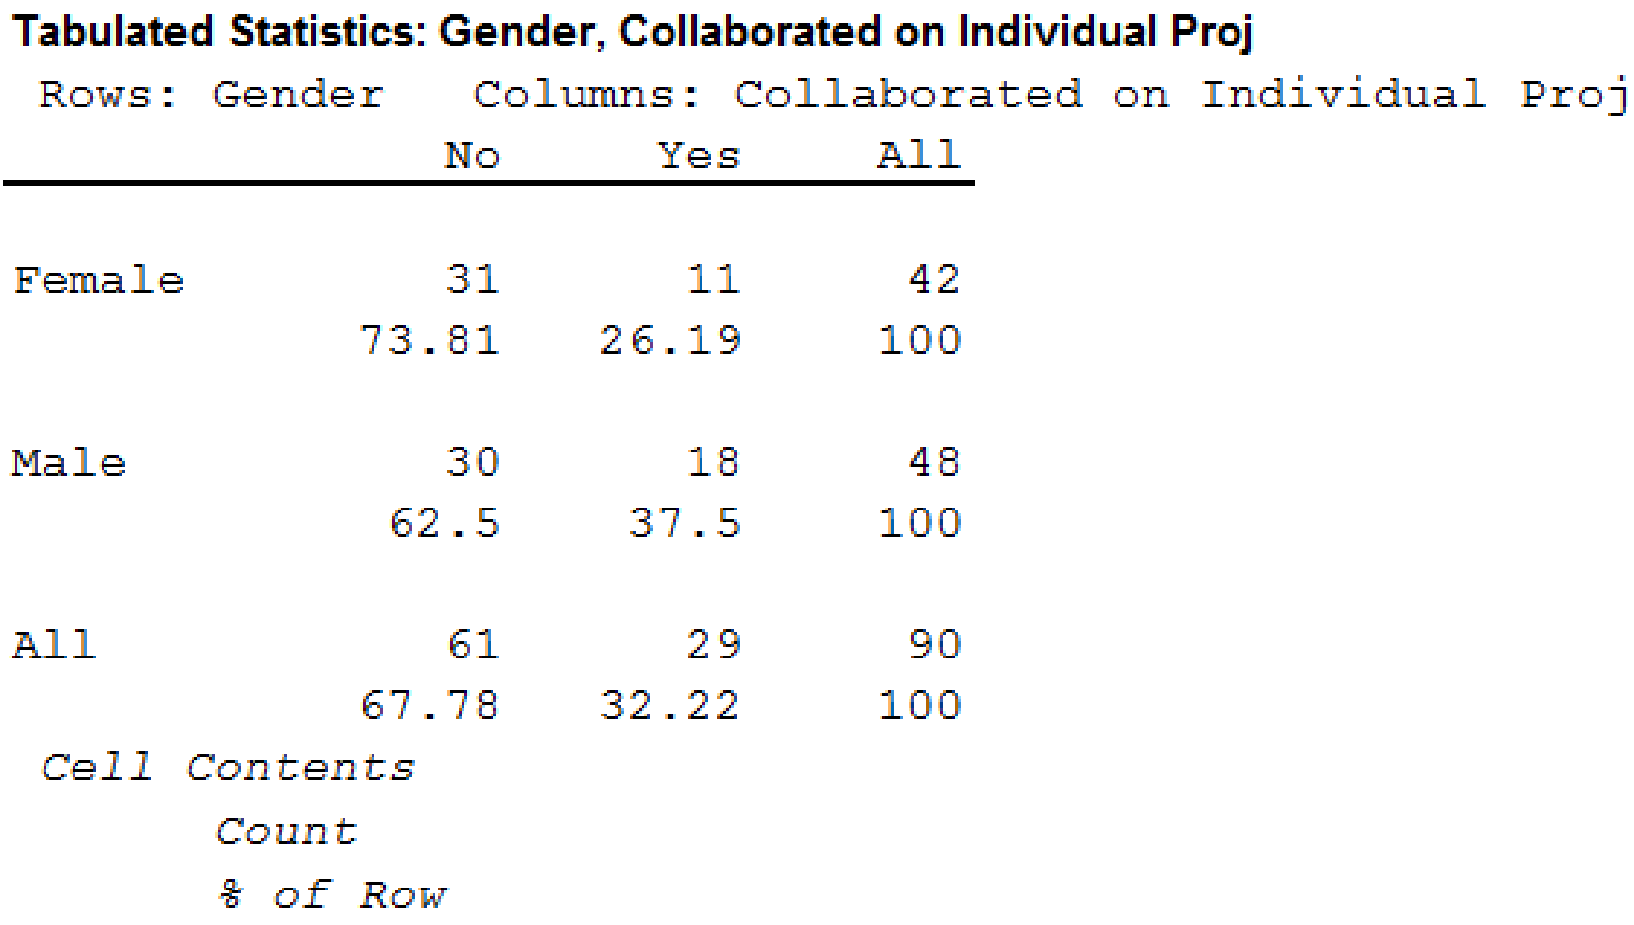
A step-by-step procedure to construct a contingency table or cross table for gender and Collaborated on Individual Project using MINITAB software given below:
- Choose stat > tables>cross tabulation and chi square.
- Choose raw data (summarized).
- In rows, enter the column of Gender.
- In columns, enter the column of Collaborated on Individual Project.
- Under display, select count
- Click OK
Output using MINITAB software is given below:
From the results, the summary table for all students who were involved in type of cheating is shown below:
| Copied from Internet | Copied on Exam | Collaborated on Individual Project | Overall Cheated | |||||
| Count | % | Count | % | Count | % | Count | % | |
| Yes | 16 | 17.778 | 18 | 20 | 29 | 32.222 | 37 | 41.111 |
| No | 74 | 82.222 | 72 | 80 | 61 | 67.778 | 53 | 58.889 |
| 90 | 100 | 90 | 100 | 90 | 100 | 90 | 100 | |
From the results, the summary table for male students who were involved in type of cheating is shown below:
| Copied from Internet | Copied on Exam | Collaborated on Individual Project | Overall Cheated | |||||
| Count | % | Count | % | Count | % | Count | % | |
| Yes | 7 | 14.583 | 9 | 18.75 | 18 | 37.5 | 21 | 43.75 |
| No | 41 | 85.417 | 39 | 81.25 | 30 | 62.5 | 27 | 56.25 |
| 48 | 100 | 48 | 100 | 48 | 100 | 48 | 100 | |
From the results, the summary table for female students who were involved in type of cheating is shown below:
| Copied from Internet | Copied on Exam | Collaborated on Individual Project | Overall Cheated | |||||
| Count | % | Count | % | Count | % | Count | % | |
| Yes | 9 | 21.428 | 9 | 21.428 | 11 | 26.190 | 16 | 38.095 |
| No | 33 | 78.571 | 33 | 78.571 | 31 | 73.810 | 26 | 61.905 |
| 42 | 100 | 42 | 100 | 42 | 100 | 42 | 100 | |
Observation:
From the MINITAB output, the percentage of males is greater in Copied from Internet, Copied on Exam, and Collaborated on Individual Project compared to females.
2.
Find the 95% confidence intervals for the proportion of all students who were involved in some type of cheating.
Find the 95% confidence intervals for the proportion of male students who were involved in some type of cheating.
Find the 95% confidence intervals for the proportion of female students who were involved in some type of cheating.
Answer to Problem 2CP
The 95% confidence intervals for the proportion of all students who were involved in some type of cheating is
The 95% confidence intervals for the proportion of male students who were involved in some type of cheating is
The 95% confidence intervals for the proportion of female students who were involved in some type of cheating is
Explanation of Solution
Calculation:
Confidence interval:
Software Procedure:
A step-by-step procedure to obtain the confidence interval using MINITAB software:
- Choose Stat > Basic Statistics > 1 Proportion.
- Choose Summarized data.
- In Number of events, enter 37. In Number of trials, enter 90.
- Check Options; enter Confidence level as 95%.
- Choose not equal in alternative.
- Click OK.
Output using MINITAB software is given below:
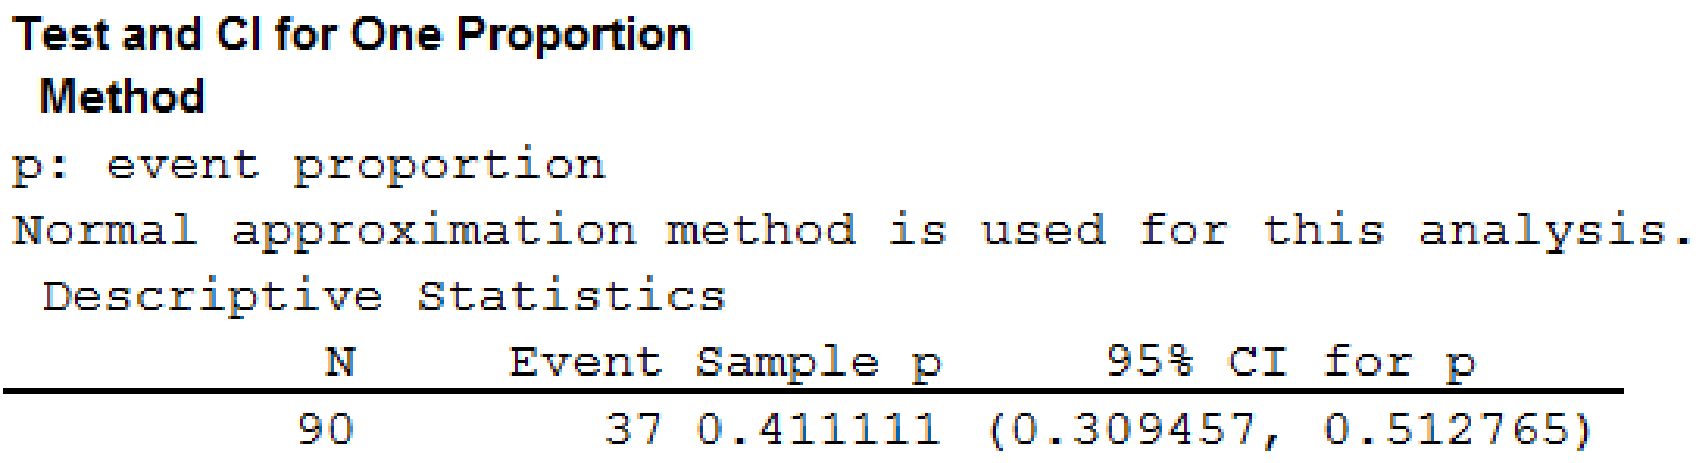
From the output, the 95% confidence intervals for the proportion of all students who were involved in some type of cheating is
Confidence interval:
Software Procedure:
A step-by-step procedure to obtain the confidence interval using MINITAB software:
- Choose Stat > Basic Statistics > 1 Proportion.
- Choose Summarized data.
- In Number of events, enter 21. In Number of trials, enter 48.
- Check Options; enter Confidence level as 95%.
- Choose not equal in alternative.
- Click OK.
Output using MINITAB software is given below:
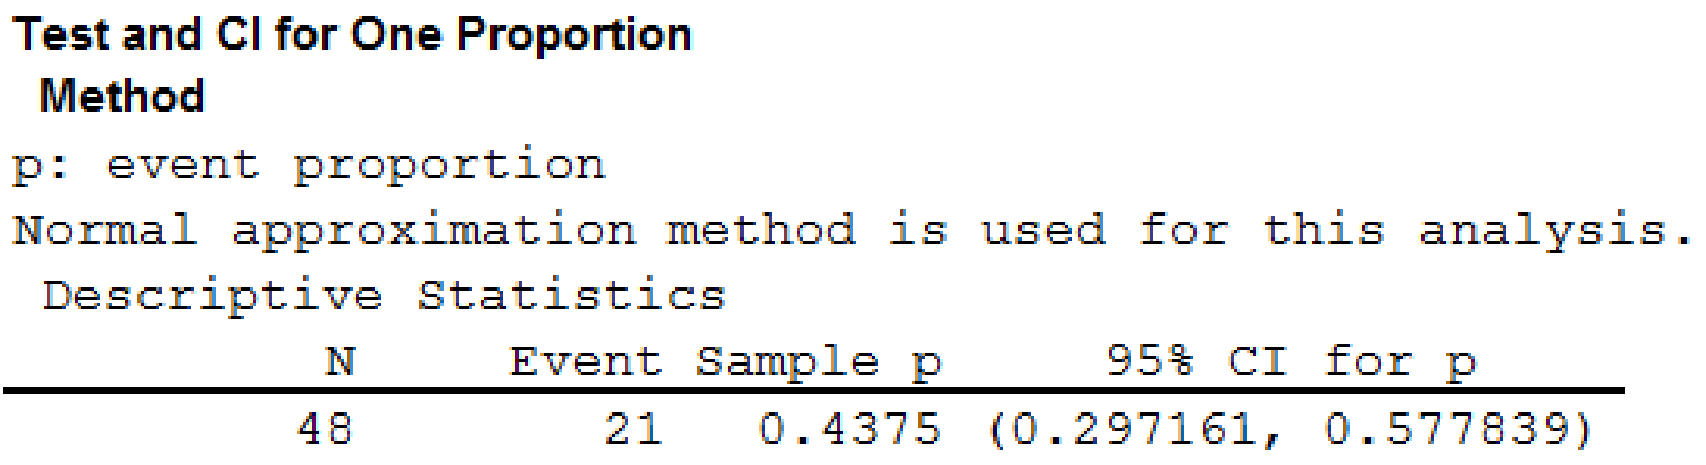
From the output, the 95% confidence intervals for the proportion of male students who were involved in some type of cheating is
Confidence interval:
Software Procedure:
A step-by-step procedure to obtain the confidence interval using MINITAB software:
- Choose Stat > Basic Statistics > 1 Proportion.
- Choose Summarized data.
- In Number of events, enter 16. In Number of trials, enter 42.
- Check Options; enter Confidence level as 95%.
- Choose not equal in alternative.
- Click OK.
Output using MINITAB software is given below:
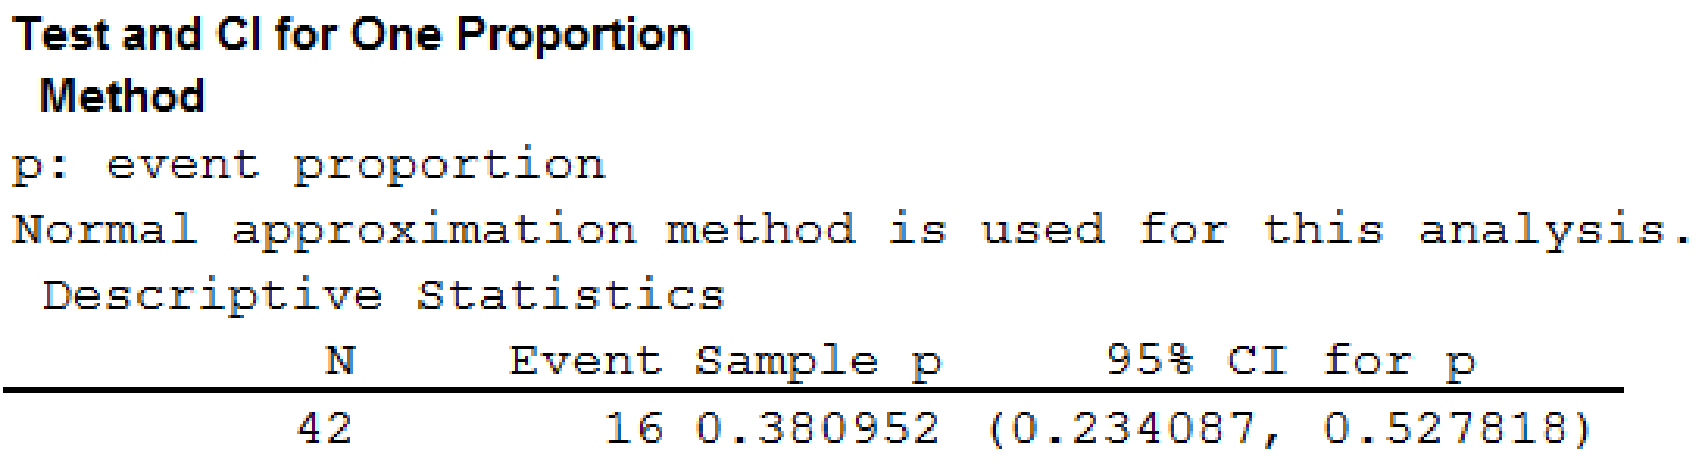
From the output, the 95% confidence intervals for the proportion of female students who were involved in some type of cheating is
3.
Check whether the proportion of business students at Bayview University who were involved in some type of cheating is less than that of business students at other institutions as reported by the Chronicle of Higher Education.
Answer to Problem 2CP
The conclusion is that the proportion of business students at Bayview University who were involved in some type of cheating is less than that of business students at other institutions as reported by the Chronicle of Higher Education.
Explanation of Solution
Calculation:
The null and alternative hypotheses are given below:
Null hypothesis:
Alternative hypothesis:
Software Procedure:
A step-by-step procedure to obtain the p-value using MINITAB software:
- Choose Stat > Basic Statistics > 1 Proportion.
- Choose Summarized data.
- In Number of events, enter 37. In Number of trials, enter 90.
- In Perform hypothesis test, enter the test proportion as 0.56.
- Check Options; enter Confidence level as 95%.
- Choose less than in alternative.
- Click OK.
Output using MINITAB software is given below:
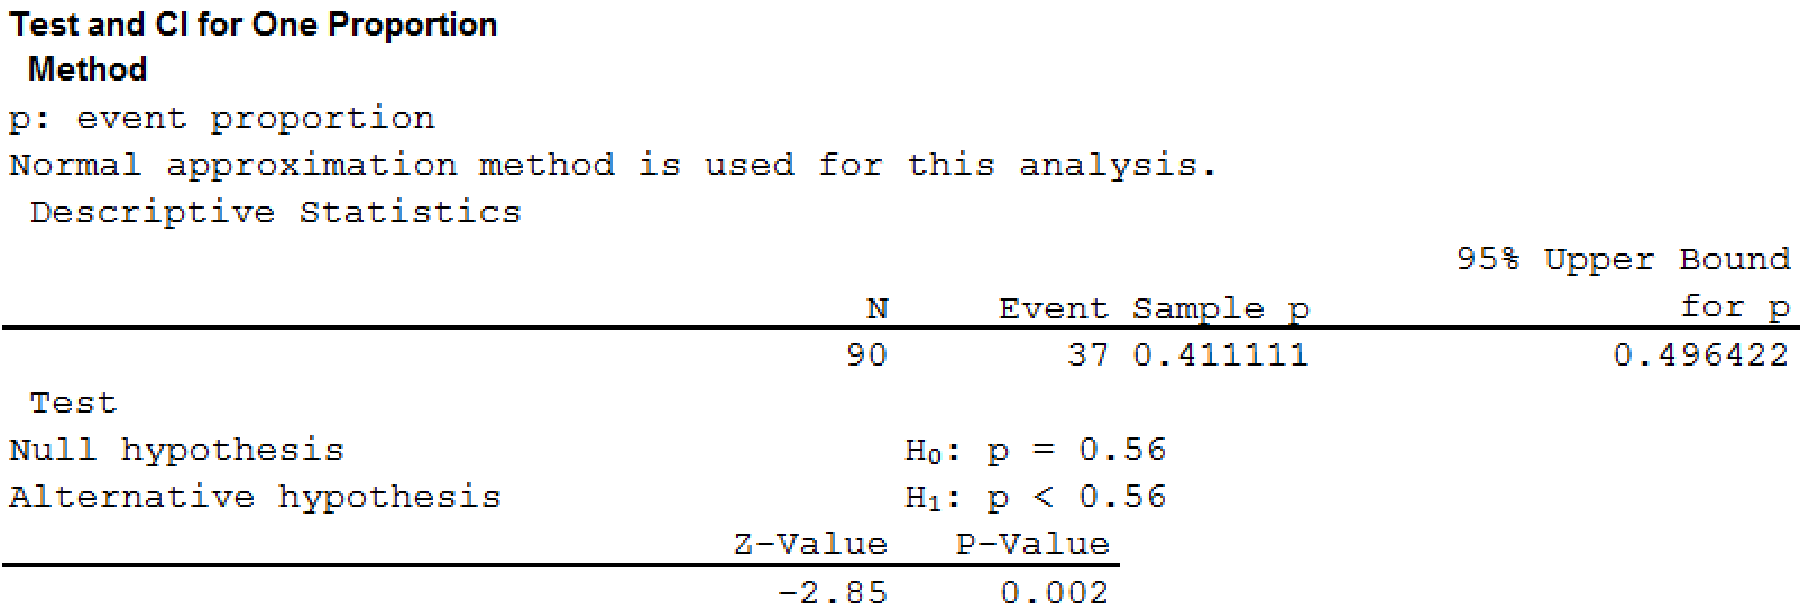
From the output, the p-value is 0.002.
Rejection rule:
If
If
Conclusion:
Here, the p-value is less than the level of significance.
That is,
By the rejection rule, the null hypothesis is rejected.
Hence, the proportion of business students at Bayview University who were involved in some type of cheating is less than that of business students at other institutions as reported by the Chronicle of Higher Education.
4.
Check whether the proportion of business students at Bayview University who were involved in some form of cheating is less than that of non-business students at other institutions as reported by the Chronicle of Higher Education.
Answer to Problem 2CP
The conclusion is that the proportion of business students at Bayview University who were involved in some form of cheating is not less than that of non-business students at other institutions as reported by the Chronicle of Higher Education.
Explanation of Solution
Calculation:
The null and alternative hypotheses most appropriate for this situation are shown below:
Null hypothesis:
Alternative hypothesis:
Software Procedure:
A step-by-step procedure to obtain the p-value using MINITAB software:
- Choose Stat > Basic Statistics > 1 Proportion.
- Choose Summarized data.
- In Number of events, enter 37. In Number of trials, enter 90.
- In Perform hypothesis test, enter the test proportion as 0.47.
- Check Options; enter Confidence level as 95%.
- Choose less than in alternative.
- Click OK.
Output using MINITAB software is given below:
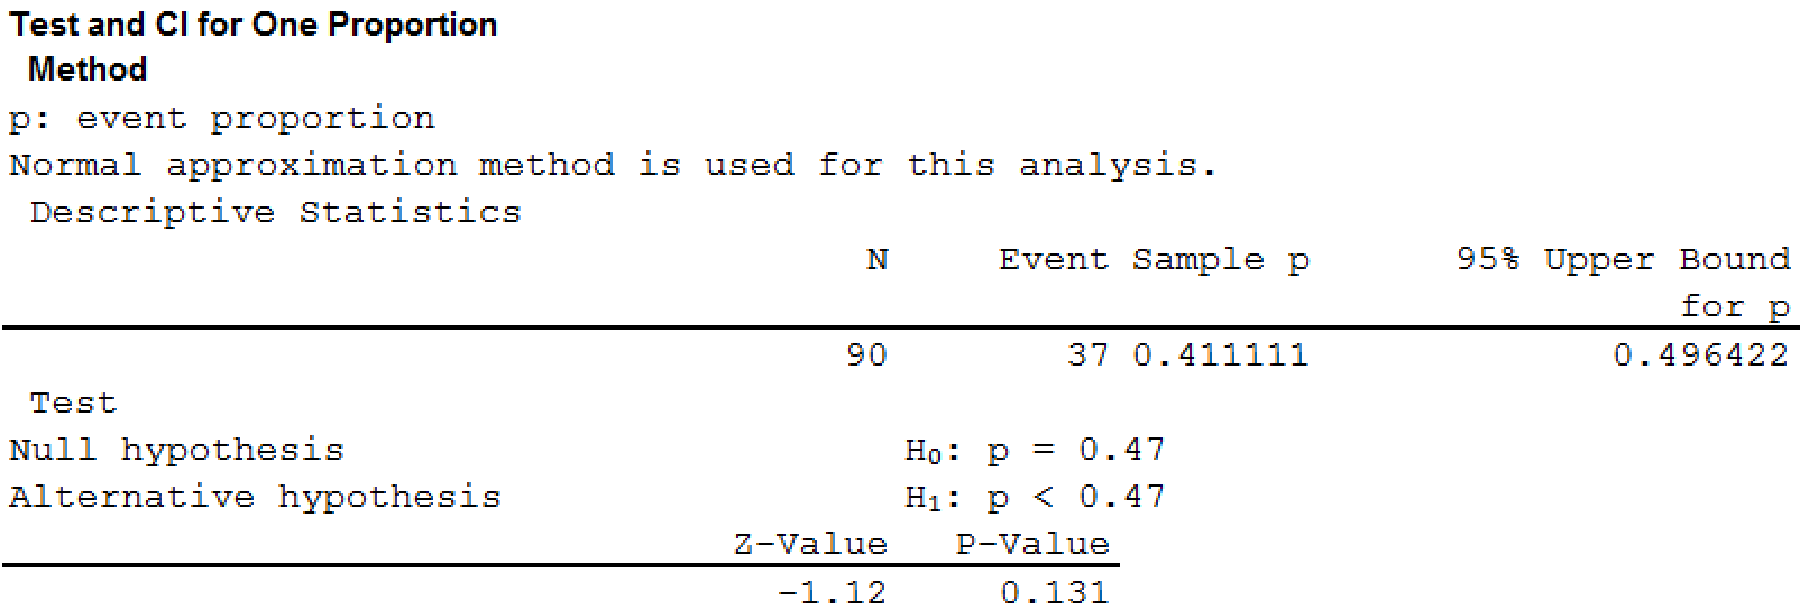
From the output, the p-value is 0.131.
Rejection rule:
If
If
Conclusion:
Here, the p-value is greater than the level of significance.
That is,
By the rejection rule, the null hypothesis is not rejected.
Hence, the proportion of business students at Bayview University who were involved in some form of cheating is not less than that of non-business students at other institutions as reported by the Chronicle of Higher Education.
5.
Find the advice that you give to the dean based upon your analysis of the data.
Explanation of Solution
From the results, it can be observed that the business students at Bayview University who were involved in some form of cheating are higher when compared to the non-business students. Hence, the dean identifies the reason that the student cannot handle the exam without cheating.
Want to see more full solutions like this?
Chapter 9 Solutions
Modern Business Statistics with Microsoft Office Excel (with XLSTAT Education Edition Printed Access Card)


- Suppose a random sample of 459 married couples found that 307 had two or more personality preferences in common. In another random sample of 471 married couples, it was found that only 31 had no preferences in common. Let p1 be the population proportion of all married couples who have two or more personality preferences in common. Let p2 be the population proportion of all married couples who have no personality preferences in common. Find a95% confidence interval for . Round your answer to three decimal places.arrow_forwardA history teacher interviewed a random sample of 80 students about their preferences in learning activities outside of school and whether they are considering watching a historical movie at the cinema. 69 answered that they would like to go to the cinema. Let p represent the proportion of students who want to watch a historical movie. Determine the maximal margin of error. Use α = 0.05. Round your answer to three decimal places. arrow_forwardA random sample of medical files is used to estimate the proportion p of all people who have blood type B. If you have no preliminary estimate for p, how many medical files should you include in a random sample in order to be 99% sure that the point estimate will be within a distance of 0.07 from p? Round your answer to the next higher whole number.arrow_forward
- A clinical study is designed to assess the average length of hospital stay of patients who underwent surgery. A preliminary study of a random sample of 70 surgery patients’ records showed that the standard deviation of the lengths of stay of all surgery patients is 7.5 days. How large should a sample to estimate the desired mean to within 1 day at 95% confidence? Round your answer to the whole number.arrow_forwardA clinical study is designed to assess the average length of hospital stay of patients who underwent surgery. A preliminary study of a random sample of 70 surgery patients’ records showed that the standard deviation of the lengths of stay of all surgery patients is 7.5 days. How large should a sample to estimate the desired mean to within 1 day at 95% confidence? Round your answer to the whole number.arrow_forwardIn the experiment a sample of subjects is drawn of people who have an elbow surgery. Each of the people included in the sample was interviewed about their health status and measurements were taken before and after surgery. Are the measurements before and after the operation independent or dependent samples?arrow_forward
- iid 1. The CLT provides an approximate sampling distribution for the arithmetic average Ỹ of a random sample Y₁, . . ., Yn f(y). The parameters of the approximate sampling distribution depend on the mean and variance of the underlying random variables (i.e., the population mean and variance). The approximation can be written to emphasize this, using the expec- tation and variance of one of the random variables in the sample instead of the parameters μ, 02: YNEY, · (1 (EY,, varyi n For the following population distributions f, write the approximate distribution of the sample mean. (a) Exponential with rate ẞ: f(y) = ß exp{−ßy} 1 (b) Chi-square with degrees of freedom: f(y) = ( 4 ) 2 y = exp { — ½/ } г( (c) Poisson with rate λ: P(Y = y) = exp(-\} > y! y²arrow_forward2. Let Y₁,……., Y be a random sample with common mean μ and common variance σ². Use the CLT to write an expression approximating the CDF P(Ỹ ≤ x) in terms of µ, σ² and n, and the standard normal CDF Fz(·).arrow_forwardmatharrow_forward
- Compute the median of the following data. 32, 41, 36, 42, 29, 30, 40, 22, 25, 37arrow_forwardTask Description: Read the following case study and answer the questions that follow. Ella is a 9-year-old third-grade student in an inclusive classroom. She has been diagnosed with Emotional and Behavioural Disorder (EBD). She has been struggling academically and socially due to challenges related to self-regulation, impulsivity, and emotional outbursts. Ella's behaviour includes frequent tantrums, defiance toward authority figures, and difficulty forming positive relationships with peers. Despite her challenges, Ella shows an interest in art and creative activities and demonstrates strong verbal skills when calm. Describe 2 strategies that could be implemented that could help Ella regulate her emotions in class (4 marks) Explain 2 strategies that could improve Ella’s social skills (4 marks) Identify 2 accommodations that could be implemented to support Ella academic progress and provide a rationale for your recommendation.(6 marks) Provide a detailed explanation of 2 ways…arrow_forwardQuestion 2: When John started his first job, his first end-of-year salary was $82,500. In the following years, he received salary raises as shown in the following table. Fill the Table: Fill the following table showing his end-of-year salary for each year. I have already provided the end-of-year salaries for the first three years. Calculate the end-of-year salaries for the remaining years using Excel. (If you Excel answer for the top 3 cells is not the same as the one in the following table, your formula / approach is incorrect) (2 points) Geometric Mean of Salary Raises: Calculate the geometric mean of the salary raises using the percentage figures provided in the second column named “% Raise”. (The geometric mean for this calculation should be nearly identical to the arithmetic mean. If your answer deviates significantly from the mean, it's likely incorrect. 2 points) Starting salary % Raise Raise Salary after raise 75000 10% 7500 82500 82500 4% 3300…arrow_forward
 Big Ideas Math A Bridge To Success Algebra 1: Stu...AlgebraISBN:9781680331141Author:HOUGHTON MIFFLIN HARCOURTPublisher:Houghton Mifflin Harcourt
 Glencoe Algebra 1, Student Edition, 9780079039897...AlgebraISBN:9780079039897Author:CarterPublisher:McGraw Hill
 Holt Mcdougal Larson Pre-algebra: Student Edition...AlgebraISBN:9780547587776Author:HOLT MCDOUGALPublisher:HOLT MCDOUGAL
 College Algebra (MindTap Course List)AlgebraISBN:9781305652231Author:R. David Gustafson, Jeff HughesPublisher:Cengage Learning