
Concept explainers
(a)
To determine:
To set the spreadsheet for calculating the relative strength of the banking sector compared to the broad market.
Introduction:
Relative strength helps to measure the extent to which a security has underperformed or it has outperformed its own industry or the entire market. Relative strength is a ratio of price of security to industry price index.
Answer to Problem 26PS
The spreadsheet is obtained and given in explanation.
Explanation of Solution
Given Information:
The data given in the website. The initial value of the sector index and S&P 500 Index is equal to 100. Each week's
The data was downloaded from the given website.
| Week | SPY rate | FSRBX rate |
| 2013.01 | 1.64 | 1.75 |
| 2013.02 | 0.17 | 0.55 |
| 2013.03 | -0.82 | -0.92 |
| 2013.04 | 0.85 | 0.93 |
| 2013.05 | 0.59 | 0.92 |
| 2013.06 | -0.21 | -0.08 |
| 2013.07 | 0.12 | 1.37 |
| 2013.08 | 1.19 | 1.80 |
| 2013.09 | -3.27 | -2.73 |
| 2013.10 | -1.00 | -0.58 |
| 2013.11 | -0.03 | -0.87 |
| 2013.12 | 3.25 | 1.09 |
| 2013.13 | -0.23 | -0.21 |
| 2013.14 | -0.47 | -3.37 |
| 2013.15 | 0.47 | 0.00 |
| 2013.16 | -2.97 | -1.55 |
| 2013.17 | -0.91 | -1.75 |
| 2013.18 | 0.07 | 0.40 |
| 2013.19 | -0.20 | 1.11 |
| 2013.20 | 2.77 | 2.50 |
| 2013.21 | 0.11 | 0.04 |
| 2013.22 | 1.21 | 0.38 |
| 2013.23 | -0.27 | -0.89 |
| 2013.24 | 0.19 | 0.52 |
| 2013.25 | -0.85 | -0.17 |
| 2013.26 | -1.02 | -1.16 |
| 2013.27 | -0.92 | 0.04 |
| 2013.28 | -1.57 | 0.04 |
| 2013.29 | 1.72 | 0.95 |
| 2013.30 | -3.60 | -1.97 |
| 2013.31 | 0.32 | 0.83 |
| 2013.32 | 3.07 | 3.47 |
| 2013.33 | 0.88 | 1.05 |
| 2013.34 | 0.59 | 0.58 |
| 2013.35 | 0.85 | 0.54 |
| 2013.36 | 0.50 | 0.21 |
| 2013.37 | -1.49 | -1.72 |
| 2013.38 | 1.96 | 2.08 |
| 2013.39 | -1.00 | 0.16 |
| 2013.40 | -1.11 | -0.37 |
| 2013.41 | -1.13 | -1.51 |
| 2013.42 | 2.91 | 3.28 |
| 2013.43 | 3.61 | 2.73 |
| 2013.44 | 1.29 | 1.60 |
| 2013.45 | -0.86 | -2.16 |
| 2013.46 | 0.79 | 1.18 |
| 2013.47 | 0.76 | 0.19 |
| 2013.48 | 0.06 | -0.19 |
| 2013.49 | 0.57 | 0.04 |
| 2013.50 | 1.11 | 1.83 |
| 2013.51 | 0.08 | -0.15 |
| 2013.52 | -2.01 | -2.22 |
| 2014.01 | -0.17 | -1.56 |
| 2014.02 | -1.24 | 0.16 |
| 2014.03 | 0.56 | -0.28 |
| 2014.04 | 2.38 | 2.74 |
| 2014.05 | 0.45 | -0.39 |
| 2014.06 | -0.32 | -2.45 |
| 2014.07 | 0.87 | 0.36 |
| 2014.08 | 1.07 | 1.63 |
| 2014.09 | -1.91 | -1.87 |
| 2014.10 | -1.15 | -1.23 |
| 2014.11 | -1.18 | -2.58 |
| 2014.12 | 0.25 | 0.29 |
| 2014.13 | 0.48 | 0.66 |
| 2014.14 | -3.26 | -2.29 |
| 2014.15 | 1.24 | 0.75 |
| 2014.16 | 0.16 | 1.54 |
| 2014.17 | 1.15 | 0.78 |
| 2014.18 | -1.17 | -1.30 |
| 2014.19 | 2.93 | 3.13 |
| 2014.20 | 0.96 | -0.52 |
| 2014.21 | -0.09 | -0.36 |
| 2014.22 | 0.05 | -0.04 |
| 2014.23 | 1.37 | 1.65 |
| 2014.24 | -1.96 | -1.07 |
| 2014.25 | 0.46 | 0.80 |
| 2014.26 | 1.49 | 1.19 |
| 2014.27 | 1.26 | 1.65 |
| 2014.28 | 0.57 | 0.35 |
| 2014.29 | 0.16 | -0.92 |
| 2014.30 | -0.69 | -1.24 |
| 2014.31 | 0.14 | 0.04 |
| 2014.32 | -0.47 | 0.39 |
| 2014.33 | -1.39 | -1.92 |
| 2014.34 | 1.24 | 1.00 |
| 2014.35 | 1.91 | 0.63 |
| 2014.36 | -0.46 | 0.08 |
| 2014.37 | -1.67 | -2.36 |
| 2014.38 | 1.32 | -0.08 |
| 2014.39 | -2.79 | -1.73 |
| 2014.40 | -0.78 | 0.04 |
| 2014.41 | -0.45 | 1.02 |
| 2014.42 | 1.41 | 2.23 |
| 2014.43 | 1.93 | 1.03 |
| 2014.44 | 1.35 | 3.02 |
| 2014.45 | 1.10 | -0.19 |
| 2014.46 | 1.60 | 1.72 |
| 2014.47 | -0.22 | -0.68 |
| 2014.48 | -0.41 | -0.38 |
| 2014.49 | 0.55 | 0.72 |
| 2014.50 | 0.31 | 0.19 |
| 2014.51 | -1.77 | -1.73 |
| 2014.52 | 3.15 | 2.41 |
| 2015.01 | 0.19 | -0.52 |
| 2015.02 | -2.10 | -2.89 |
| 2015.03 | 2.04 | 2.59 |
| 2015.04 | -1.76 | -1.81 |
| 2015.05 | 0.29 | 0.81 |
| 2015.06 | 1.72 | 1.71 |
| 2015.07 | 0.47 | 1.35 |
| 2015.08 | -0.50 | -1.07 |
| 2015.09 | -0.13 | 0.07 |
| 2015.1 | 1.99 | 2.13 |
| 2015.11 | -0.32 | -0.51 |
| 2015.12 | -0.29 | -0.66 |
| 2015.13 | -0.23 | -0.04 |
| 2015.14 | -0.64 | -0.41 |
| 2015.15 | 1.90 | 1.37 |
| 2015.16 | 0.24 | 3.11 |
| 2015.17 | 0.80 | 0.57 |
| 2015.18 | -2.48 | -2.76 |
| 2015.19 | -1.66 | -1.49 |
| 2015.2 | 1.01 | 0.59 |
| 2015.21 | 0.48 | 1.06 |
| 2015.22 | -2.83 | -0.80 |
| 2015.23 | -0.12 | -1.72 |
| 2015.24 | -0.17 | -1.60 |
| 2015.25 | 2.29 | 2.08 |
| 2015.26 | -0.53 | -0.11 |
| 2015.27 | -2.44 | -1.30 |
| 2015.28 | 0.34 | 2.67 |
| 2015.29 | 3.25 | 2.31 |
| 2015.3 | 0.17 | 0.72 |
| 2015.31 | -0.93 | -1.99 |
| 2015.32 | 2.89 | 1.88 |
| 2015.33 | -0.67 | -1.14 |
| 2015.34 | 1.23 | 0.54 |
| 2015.35 | -0.86 | -0.54 |
| 2015.36 | 1.73 | 1.80 |
| 2015.37 | -0.38 | -0.25 |
| 2015.38 | 1.61 | 0.78 |
| 2015.39 | 1.08 | 0.67 |
| 2015.4 | 1.20 | 0.87 |
| 2015.41 | 0.15 | -1.21 |
| 2015.42 | 0.78 | 0.28 |
| 2015.43 | -1.00 | -1.01 |
| 2015.44 | 1.25 | 1.62 |
| 2015.45 | 1.58 | 0.28 |
| 2015.46 | -0.05 | -0.62 |
| 2015.47 | -0.09 | -0.49 |
| 2015.48 | 0.85 | 1.12 |
| 2015.49 | 0.65 | 2.04 |
| 2015.5 | -1.11 | 0.03 |
| 2015.51 | 0.62 | 0.34 |
| 2015.52 | -0.76 | -0.74 |
| 2016.01 | 1.92 | 0.34 |
| 2016.02 | -0.29 | -0.65 |
| 2016.03 | -0.48 | -0.27 |
| 2016.04 | 1.88 | 1.78 |
| 2016.05 | -0.60 | -0.20 |
| 2016.06 | 1.24 | 1.82 |
| 2016.07 | -0.29 | -0.50 |
| 2016.08 | -4.57 | -4.10 |
| 2016.09 | 1.52 | 0.35 |
| 2016.1 | -1.21 | -1.77 |
| 2016.11 | 3.51 | 3.45 |
| 2016.12 | -0.97 | -2.21 |
| 2016.13 | 1.58 | -0.31 |
| 2016.14 | 0.74 | -0.24 |
| 2016.15 | 2.27 | 3.50 |
| 2016.16 | 0.61 | -0.30 |
| 2016.17 | 0.93 | 0.95 |
| 2016.18 | -0.03 | 0.34 |
| 2016.19 | 1.16 | 0.60 |
| 2016.2 | -0.61 | -0.97 |
| 2016.21 | 1.57 | 0.84 |
| 2016.22 | -1.97 | -2.20 |
| 2016.23 | 1.78 | 1.47 |
| 2016.24 | -1.64 | -2.55 |
| 2016.25 | -0.08 | -0.41 |
| 2016.26 | 1.70 | 1.18 |
| 2016.27 | 1.22 | 0.24 |
| 2016.28 | -0.87 | -3.31 |
| 2016.29 | -5.46 | -5.40 |
| 2016.3 | -0.90 | -4.03 |
| 2016.31 | 0.63 | 5.80 |
| 2016.32 | 0.00 | 3.71 |
| 2016.33 | 2.51 | 0.07 |
| 2016.34 | -0.50 | -1.49 |
| 2016.35 | -1.03 | -2.52 |
| 2016.36 | 1.94 | 1.66 |
| 2016.37 | 2.55 | 2.50 |
| 2016.38 | 0.40 | -1.74 |
| 2016.39 | 2.14 | 4.61 |
| 2016.4 | 0.31 | -2.58 |
| 2016.41 | -4.26 | -7.57 |
| 2016.42 | 2.63 | 2.98 |
| 2016.43 | -1.57 | -6.13 |
| 2016.44 | -4.01 | -2.14 |
| 2016.45 | 0.45 | -1.90 |
| 2016.46 | -1.14 | -2.72 |
| 2016.47 | 3.15 | 5.34 |
| 2016.48 | 1.52 | -0.24 |
| 2016.49 | -2.48 | -6.53 |
| 2016.5 | 1.18 | 1.08 |
| 2016.51 | -0.56 | -1.15 |
| 2016.52 | -4.06 | -6.69 |
| 2017.01 | -0.82 | 0.56 |
| 2017.02 | -5.77 | -7.23 |
| 2017.03 | 0.75 | 10.91 |
| 2017.04 | 4.91 | 7.74 |
| 2017.05 | -4.67 | -6.93 |
| 2017.06 | 1.56 | -1.07 |
| 2017.07 | 0.35 | 0.45 |
| 2017.08 | -1.32 | -5.12 |
| 2017.09 | -3.08 | -6.53 |
| 2017.1 | -0.07 | 1.77 |
| 2017.11 | 2.41 | 11.69 |
| 2017.12 | -0.43 | -7.26 |
| 2017.13 | 4.09 | 3.60 |
| 2017.14 | -2.56 | -4.91 |
| 2017.15 | 3.82 | 4.78 |
| 2017.16 | 0.81 | 2.42 |
| 2017.17 | 1.37 | 1.95 |
| 2017.18 | -1.85 | -4.99 |
| 2017.19 | 2.70 | 1.13 |
| 2017.2 | -3.52 | -4.13 |
| 2017.21 | 1.96 | 0.15 |
| 2017.22 | -2.89 | -7.05 |
| 2017.23 | -0.11 | -4.31 |
| 2017.24 | -2.87 | -4.07 |
| 2017.25 | -3.08 | -4.19 |
| 2017.26 | -0.96 | -4.67 |
| 2017.27 | -1.95 | -6.75 |
| 2017.28 | 1.72 | 12.69 |
| 2017.29 | -0.40 | 1.30 |
| 2017.3 | 0.55 | 7.63 |
| 2017.31 | 2.54 | 1.03 |
| 2017.32 | 0.62 | -1.55 |
| 2017.33 | -0.40 | -3.05 |
| 2017.34 | -0.66 | 3.25 |
| 2017.35 | -3.40 | 3.86 |
| 2017.36 | 1.35 | 2.30 |
| 2017.37 | -0.99 | 10.94 |
| 2017.38 | -2.63 | -10.46 |
| 2017.39 | -8.70 | -5.66 |
| 2017.4 | -19.79 | -18.66 |
| 2017.41 | 5.33 | 9.99 |
| 2017.42 | -6.63 | -7.68 |
| 2017.43 | 11.25 | 13.61 |
| 2017.44 | -3.07 | -8.20 |
| 2017.45 | -7.71 | -6.40 |
| 2017.46 | -8.19 | -20.03 |
| 2017.47 | 13.29 | 25.04 |
| 2017.48 | -2.39 | -0.34 |
| 2017.49 | 1.20 | -6.79 |
| 2017.5 | -0.09 | 2.69 |
| 2017.51 | -1.17 | -2.55 |
| 2017.52 | 6.66 | -0.29 |
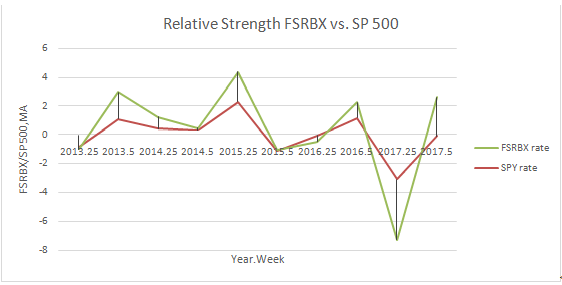
The graph of the relative strength for S&P 500 and FB is plotted as shown below.
Using the price movements and their changing speed, the relative strength of the fund against the S&P 500 can be measured.
(b)
To determine:
To determine the instances where the relative strength ratio exceeds by minimum 5% from its 5 weeks prior value and to determine the number of weeks immediately following the substantial increase the banking sector outperforms S&P500 and how many weeks banking sector underperforms S&P500.
Introduction:
Relative strength helps to measure the extent to which a security has underperformed or it has outperformed its own industry or the entire market. Relative strength is a ratio of price of security to industry price index.
Answer to Problem 26PS
As per the data, 16 times the relative strength increases more than 5%.
Explanation of Solution
Given Information:
The data is available in the given website.
Of the 255 total instances, there are 16 times when the relative strength increases by greater than 5% over the interval of 5 weeks.
Here, it is seen that 10 times the FSRBX underperformed the S&P 500 following the increase of more than 5%.
There are 6 times that FSRBX outperformed S&P 500 following the increase of more than 5%.
(c)
Requirement 3 To Determine:
To determine the instances where the relative strength ratio decreases by minimum 5% from its 5 weeks prior value and to determine the number of weeks immediately following the substantial decrease the banking sector outperforms S&P 500 and how many weeks banking sector underperforms S&P 500.
Introduction:
Relative strength helps to measure the extent to which a security has underperformed or it has outperformed its own industry or the entire market. Relative strength is a ratio of price of security to industry price index.
Answer to Problem 26PS
As per the data, 31 times the relative strength moves decrease by greater than 5%.
Explanation of Solution
Given Information:
The data is available in the given website.
Of the 255 total instances, there are 31 times when the relative strength decreases by greater than 5% over the interval of 5 weeks.
Here it is seen that 17 times the FSRBX underperformed S&P 500 following the decrease of more than 5%.
There are 14 times that FSRBX outperformed S&P 500 following the decrease of more than 5%.
(d)
Requirement 4 To Determine:
To determine how well the relative strength rule functions in identifying the selling or buying opportunities.
Introduction:
Relative strength helps to measure the extent to which a security has underperformed or it has outperformed its own industry or the entire market. Relative strength is a ratio of price of security to industry price index.
Answer to Problem 26PS
The data above gives the bullish sign and the bearish sign.
Explanation of Solution
Given Information:
The data is available in the given website.
We can see the relative strength depicted in second part of requirement as bullish sign. Here the FB fund is likely to underperform the S&P 500 index than to perform better than the index according to this signal.
We can see the relative strength depicted in third part of requirement as bearish sign. Here the FB fund did not give a better performance than the index but there is no statistical difference succeeding the considerable change in the relative strength. There is random successive performance.
Want to see more full solutions like this?
Chapter 9 Solutions
ESSEN.OF.INVESTMENTS+CONNECT


- Expected Standard Stock Return Beta Deviation A B 12% 16 0.75 1.25 28% 37 The market index has a standard deviation of 22% and the risk-free rate is 9%. Required: a. What are the standard deviations of stocks A and B? b. Suppose that we were to construct a portfolio with proportions: Stock A Stock B T-bills 0.25 0.50 0.25 Compute the expected return, beta, nonsystematic standard deviation, and standard deviation of the portfolio. Complete this question by entering your answers in the tabs below. Required A Required B What are the standard deviations of stocks A and B? Note: Do not round intermediate calculations. Round your answers to 2 decimal places. Stock A 0.33 % Stock B 0.46 %arrow_forwardDon't used hand raiting and don't used Ai solutionarrow_forwardCould you explain what are the Biblical principles researchers that can follow to mitigate researcher bias? How to use of Biblical ethics to synthesize the literature to avoid misrepresentation of the literature? How researchers can demonstrate Biblical ethics when collecting and analyzing data?arrow_forward
- The manager of company A is thinking about adding an air conditioner to the office. The AC will cost $1630 to buy and install. The manager plans to use the AC for 5 years and each year's depreciation rate is 18% of the purchase price. The manager expects to sell the AC in 5 years for $880.The tax rate is 15% and the company's WACC is 15%. If the manager considers this purchase of AC as an investment, what is the NPV (keep two decimal places and assume that the AC will not affect the operations of the company)?arrow_forwardProblem 5-5 Calculating IRR A firm has a project with the following cash flows: Year Cash Flow 0 -$27,700 1 23 11,700 14,700 10,700 The appropriate discount rate is 18 percent. What is the IRR for this project? (Do not round intermediate calculations and enter your answer as a percent rounded to 2 decimal places, e.g., 32.16.) IRR %arrow_forwardCould you help to explain: How researchers can demonstrate Biblical ethics when conducting a literature review? How researchers can demonstrate Biblical ethics when communicating with a research team or university committee? How researchers can demonstrate Biblical ethics when recruiting participants. Provide Biblical and/or scholarly support for all assertions?arrow_forward
- Could you please help explain what is the Biblical ethics in research? How do they establish a firm ethical foundation based on Biblical principles? What should they do to reduce the researcher bias as well as misrepresenting the literature and study findings? How Christians would like to ensure of being obedient to God in the research and study conduct?arrow_forwardI need answer typing clear urjent no chatgpt used pls i will give 5 Upvotes.arrow_forward< When you purchased your car, you took out a 5-year annual-payment loan with an interest rate of 5% per year. The annual payment on the car is $5,200. You have just made a payment and have now decided to pay off the loan by repaying the outstanding balance. What is the payoff amount for the following scenarios? a. You have owned the car for 1 year (so there are 4 years left on the loan)? b. You have owned the car for 4 years (so there is 1 year left on the loan)? a. You have owned the car for 1 year (so there are 4 years left on the loan)? The payoff if there are 4 years left on the loan is $ (Round to the nearest cent.) b. You have owned the car for 4 years (so there is 1 year left on the loan)? The payoff if there is 1 year left on the loan is $ (Round to the nearest cent.)arrow_forward
- Victoria Exports (Canada). A Canadian exporter, Victoria Exports, will be receiving six payments of €13,800, ranging from now to 12 months in the future. Since the company keeps cash balances in both Canadian dollars and U.S. dollars, it can choose which currency to exchange the euros for at the end of the various periods. Which currency appears to offer the better rates in the forward market? (Click on the icon to import the table into a spreadsheet.) Period Days Forward spot 1 month C$/euro 1.3347 1.3370 US$/euro 1.3219 1.3224 m 2 months 3 months 1.3392 30 60 1.3229 90 1.3235 180 1.3438 12 months 360 1.3464 1.3239 1.3269 6 months 1.3416 Calculate the forward premium, the Canadian dollar proceeds, and the difference from the spot rate proceeds in the C$/Euro forward market below: (Round the forward premium to three decimal places and the Canadian dollar amounts to the nearest cent.) Days Forward Premium C$ Proceeds of Difference Period Forward C$/euro on the C$/euro €13,800 Over Spot…arrow_forwardidentify the primary sources of financing, both traditional and alternative, accessible to companies seeking sources of funding. To do so, you should: Collect and curate data and documentary resources from various sources (magazine articles, newspapers, online content, working papers from various institutions, activity reports, performance reports, legal regulations, speeches, appearances, press conferences, etc.). Analyze the documentary content you have previously curated and collected. During your analysis, consider the context, location, timing, and target audience of the texts. Reference Article: One Park Financial. (2022). Best alternative business loans and financing for entrepreneurs. https://www.oneparkfinancial.com/blog/alternative-business-funding Questions: Identify and summarize the traditional financial avenues available to businesses. What are the most innovative financing options they could find? Open-ended question: if you were in the opposite position, as an…arrow_forwardXYZ stock price and dividend history are as follows: Beginning-of- $ 130 Dividend Paid at Year Year Price Year-End 2021 $ 2 2022 2023 153 2 2024 128 133 2 2 An investor buys five shares of XYZ at the beginning of 2021, buys another two shares at the beginning of 2022, sells one share at the beginning of 2023, and sells all six remaining shares at the beginning of 2024. Required: a. What are the arithmetic and geometric average time-weighted rates of return for the investor? Note: Do not round intermediate calculations. Round your answers to 2 decimal places. Arithmetic time-weighted average returns Geometric time-weighted average returns % % b-1. Prepare a chart of cash flows for the four dates corresponding to the turns of the year for January 1, 2021, to January 1, 2024. Note: Negative amounts should be indicated by a minus sign. Date 01/01/2021 01/01/2022 Cash Flow 01/01/2023 01/01/2024 b-2. What is the dollar-weighted rate of return? (Hint. If your calculator cannot calculate…arrow_forward
 Essentials Of InvestmentsFinanceISBN:9781260013924Author:Bodie, Zvi, Kane, Alex, MARCUS, Alan J.Publisher:Mcgraw-hill Education,

 Foundations Of FinanceFinanceISBN:9780134897264Author:KEOWN, Arthur J., Martin, John D., PETTY, J. WilliamPublisher:Pearson,
 Fundamentals of Financial Management (MindTap Cou...FinanceISBN:9781337395250Author:Eugene F. Brigham, Joel F. HoustonPublisher:Cengage Learning
 Corporate Finance (The Mcgraw-hill/Irwin Series i...FinanceISBN:9780077861759Author:Stephen A. Ross Franco Modigliani Professor of Financial Economics Professor, Randolph W Westerfield Robert R. Dockson Deans Chair in Bus. Admin., Jeffrey Jaffe, Bradford D Jordan ProfessorPublisher:McGraw-Hill Education