Concept explainers
Requirement 1 To Determine:
To calculate the four month moving average of the stock and S&P 500 over time and to plot the moving average against the actual stock price level. To find the instances where the price series and moving average cross and to determine if stock is likely to increase or not when the price crosses the moving average. To determine the reliability of the investment rule based on moving averages. To perform the analysis on stock price as well as S&P 500.
Introduction:
For a stock price, the moving average is the average stock price over a certain given time interval. This interval however gets updated with time. In case of a 50 day moving average, the average price is traded over the prior 50 days.
Answer to Problem 1WM
Yes there are places where the month moving average crosses the stock price line.
Explanation of Solution
Given Information:
The data is available in the given website for ANF and S&P Index.
The data was downloaded from the given website.
The four month moving average was calculated. This is done as Sum of month1, month2, month3 and month4 and the total divided by 4.
The points where the four month moving average crosses the line of the stock price was identified.
As we can see from the graph, when the moving average line crosses the stock price line, there are chances of movement of price.
The price of the stock goes down in the case when price line crosses the moving average line from above, while when it crosses from below and moves upwards, the stock prices have increased. This shows that direction of price line crossing is important.
From the graphs, it is clear that every time, the price movement has been correctly given by the four month moving average rule. Hence we can say that this investment rule is reliable.
The graphs are given as below.

Requirement 2 To Determine:
To give the relative strength of the stock compared to S&P 500. To identify the instances where there is more than 10% point increase in relative strength of stock along with instances where there is more than 10% point decrease. To determine if the in the following months, the stock can outperform or underperform S&P when relative strength increased or decreased respectively. To determine the reliability of investment rule based on relative strength.
Introduction:
Relative strength helps to measure the extent to which a security has underperformed or it has outperformed its own industry or the entire market. Relative strength is a ratio of price of security to industry price index.
Answer to Problem 1WM
Stock prices are likely to outperform the S&P. This is a reliable strategy.
Explanation of Solution
Given Information:
The data is available in the given website for the stock price and S&P.
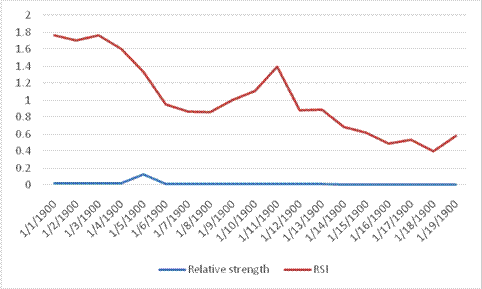
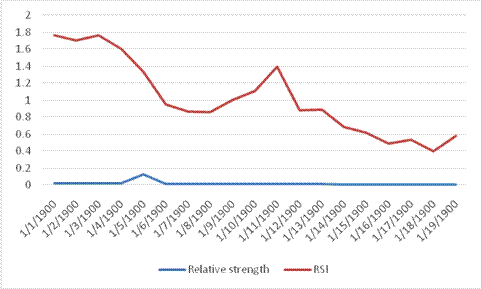
To obtain relative strength, the price of one stock is divided by another stock price. Here ANF, S&P500 are the two stocks under consideration.

RSI is obtained as 100 − (100/(1+RS)).
The points where RSI percentage is greater than 10% is evident from the graph.
The RSI value change in percentage is given by the price change line.
The stock price could outperform S&P.
As is clear from the graph, this strategy is reliable. The relative strength of the stock can be obtained and when it shows upswing, one can enter and when the relative strength is weak, one can exit.
| Date | Relative strength | Price change | RSI |
| 11/1/2013 | 0.01629 | 0.0564857 | 1.61 |
| 12/1/2013 | 0.01538 | -0.114718 | 1.51 |
| 1/1/2014 | 0.01741 | -0.07382 | 1.68 |
| 2/1/2014 | 0.01841 | 0.0352 | 1.8074 |
| 3/1/2014 | 0.01776 | 0.04622 | 1.7449 |
| 4/1/2014 | 0.01694 | -0.0127069 | 1.666 |
| 5/1/2014 | 0.01715 | -0.11658 | 1.687 |
| 6/1/2014 | 0.01915 | 0.07166 | 1.88 |
| 7/1/2014 | 0.01778 | -0.02398 | 1.75 |
| 8/1/2014 | 0.0182 | 0.11291 | 1.79 |
| 9/1/2014 | 0.01615 | 0.09959 | 1.59 |
| 10/1/2014 | 0.01454 | 0.1589 | 1.44 |
| 11/1/2014 | 0.1224 | -0.003743 | 1.21 |
| 12/1/2014 | 0.1227 | 0.08039 | 1.21 |
| 1/1/2015 | 0.01129 | 0.081009 | 1.11 |
| 2/1/2015 | 0.01037 | 0.08575 | 1.03 |
| 3/1/2015 | 0.0095 | -0.011365 | 0.94 |
| 4/1/2015 | 0.0095 | 0.09887 | 0.95 |
| 5/1/2015 | 0.00865 | -0.08307 | 0.86 |
| 6/1/2015 | 0.0094 | 0.08409 | 0.93 |
| 7/1/2015 | 0.0087 | -0.00145 | 0.85 |
| 8/1/2015 | 0.0086 | -0.16643 | 0.85 |
| 9/1/2015 | 0.01002 | 0.0766 | 0.99 |
| 10/1/2015 | 0.0093 | -0.2061 | 0.92 |
| 11/1/2015 | 0.0112 | -0.083 | 1.1 |
| 12/1/2015 | 0.0121 | -0.024 | 1.19 |
| 1/1/2016 | 0.0124 | -0.112 | 1.22 |
| 2/1/2016 | 0.138 | -0.0186 | 1.36 |
| 3/1/2016 | 0.0141 | 0.149 | 1.38 |
| 4/1/2016 | 0.0119 | 0.267 | 1.78 |
| 5/1/2016 | 0.0088 | 0.105 | 0.87 |
| 6/1/2016 | 0.0078 | -0.134 | 0.78 |
| 7/1/2016 | 0.0089 | 0.142 | 0.88 |
| 8/1/2016 | 0.0076 | 0.093 | 0.75 |
| 9/1/2016 | 0.0069 | 0.063 | 0.68 |
| 10/1/2016 | 0.0065 | 0.049 | 0.64 |
| 11/1/2016 | 0.0061 | 0.169 | 0.61 |
| 12/1/2016 | 0.0051 | 0.049 | 0.51 |
| 1/1/2017 | 0.0049 | 0.068 | 0.48 |
| 2/1/2017 | 0.0048 | 0.002 | 0.48 |
| 3/1/2017 | 0.0048 | -0.013 | 0.48 |
| 4/1/2017 | 0.0049 | -0.088 | 0.49 |
| 5/1/2017 | 0.0053 | 0.047 | 0.53 |
| 6/1/2017 | 0.0051 | 0.224 | 0.5 |
| 7/1/2017 | 0.0039 | -0.294 | 0.39 |
| 8/1/2017 | 0.0051 | -0.129 | 0.51 |
| 9/1/2017 | 0.0057 | 0.068 | 0.57 |
Want to see more full solutions like this?
Chapter 9 Solutions
ESSEN.OF.INVESTMENTS+CONNECT
- Dont answer i will unhelpful with incorrect values . please comment i will write values.arrow_forwardWhat is corporate finance? explain the part of finance.arrow_forwardPfizer Pharmecuticals has a $21,000 par value bond outstanding that pays 10 percent annual interest. The current yield to maturity on such bonds in the market is 13 percent. Compute the price of the bonds for the following maturity dates: a. 30 years b. 15 yearsarrow_forward
- Purina Pet Food earned $74 million last year and paid out 20 percent of earnings in dividends. a. By how much did the company's retained earnings increase? b. With 36 million shares outstanding and a stock price of $18, what was the dividend yield?arrow_forwardProfessor Brown has just retired after 25 years with Jessup University. Her total pension funds have an accumulated value of $504,000, and her life expectancy is 25 more years. Her pension fund manager assumes he can earn a 9 percent return on her assets. What will be her yearly annuity for the next 25 years?arrow_forwardCaroline Moore has a contract in which she will receive the following payments for the next four years: $10,000, $11,000, $9,000, and $8,000. She will then receive an annuity of $13,000 a year from the end of the 4th through the end of the 10th year. The appropriate discount rate is 11 percent. What is the percent value of all future payments?arrow_forward
- Nick Weber wants to have $120,000 at the end of 10 years, and his only investment outlet is an 8 percent long-term certicate of deposit (compounded annually). With the certificate of deposit, he made an initial investment at the beginning of the year year. How much does Nick need to deposit to get the $120,000 at the end of 10 years. a. What amount could Nick pay at the end of each year annually for 10 years to achieve this same objective?arrow_forwardHigh Hand Nursery has total assests of $900,000, current liabilities of $202,000, and long-term liabilities of $104,000. There is $90,000 in preferred stock outstanding. Twenty thousand shares of common stock have been issued. a. Compute book value (net worth) per share. b. If there is $40,000 in earnings available to common stockholders for dividends, and the firm's stock has a P/E of 22 times earnings per share, what is the current price of the stock? c. What is the ratio of market value per share to book value per share?arrow_forwardNeed the WACC % WACC and Optimal Capital Structure F. Pierce Products Inc. is considering changing its capital structure. F. Pierce currently has no debt and no preferred stock, but it would like to add some debt to take advantage of the tax shield. Its investment banker has indicated that the pre-tax cost of debt under various possible capital structures would be as follows: Market Debt-to-Value Ratio (wd) Market Equity-to-Value Ratio (ws) Market Debt-toEquity Ratio (D/S) Before-Tax Cost ofDebt (rd) 0.0 1.0 0.00 6.0 % 0.10 0.90 0.1111 6.4 0.20 0.80 0.2500 7.0 0.30 0.70 0.4286 8.2 0.40 0.60 0.6667 10.0 F. Pierce uses the CAPM to estimate its cost of common equity, rs, and at the time of the analaysis the risk-free rate is 5%, the market risk premium is 7%, and the company's tax rate is 25%. F. Pierce estimates that its beta now (which is "unlevered" because it currently has no debt) is 1.4. Based on this information, what…arrow_forward
- Ned's Co. has an average collection period of 45 days and an operating cycle of 130 days. It has a policy of keeping at least $10 on hand as a minimum cash balance, and has a beginning cash balance for the first quarter of $20. Beginning receivables for the quarter amount to $35. Sales for the first and second quarters are expected to be $110 and $125, respectively, while purchases amount to 80% of the next quarter's forecast sales. The accounts payable period is 90 days. What are the cash disbursements for the first quarter? Question 4 options: $92 $88 $76 $100 $110arrow_forwardLiberal credit terms for customers is associated with a restrictive short-term financial policy. Question 3 options: True Falsearrow_forwardAn accounts payable period decrease would increase the length of a firm's cash cycle. Consider each in isolation. Question 6 options: True Falsearrow_forward
 Essentials Of InvestmentsFinanceISBN:9781260013924Author:Bodie, Zvi, Kane, Alex, MARCUS, Alan J.Publisher:Mcgraw-hill Education,

 Foundations Of FinanceFinanceISBN:9780134897264Author:KEOWN, Arthur J., Martin, John D., PETTY, J. WilliamPublisher:Pearson,
 Fundamentals of Financial Management (MindTap Cou...FinanceISBN:9781337395250Author:Eugene F. Brigham, Joel F. HoustonPublisher:Cengage Learning
 Corporate Finance (The Mcgraw-hill/Irwin Series i...FinanceISBN:9780077861759Author:Stephen A. Ross Franco Modigliani Professor of Financial Economics Professor, Randolph W Westerfield Robert R. Dockson Deans Chair in Bus. Admin., Jeffrey Jaffe, Bradford D Jordan ProfessorPublisher:McGraw-Hill Education


