
Concept explainers
Videos
Introduction:
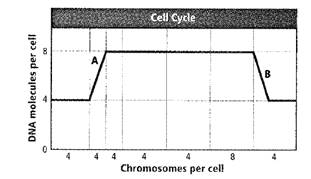
Cells reproduce by a cycle of growing and dividing called the cell cycle. There are three main stages of a cell cycle; interphase, mitosis and cytokinesis. The given graph shows a cell over the course of its cell cycle.
Answer to Problem 21A
Correct answer :
The correct answer is option B. cytokinesis
Explanation of Solution
Explanation/justification for the correct answer:
Option B. cytokinesis−The part labeled Bshows cytokinesis. It is the stage in which a cell divides into two daughter cells. The cytoplasm divides resulting in genetically identical daughter cells. Each daughter cell receives half the number of DNA molecules. Hence this is the correct option.
Explanation for incorrect answer:
Option A. interphase−This is the first stage of cell cycle in which there is replication of DNA. As per the graph DNA molecules decrease from 8 to 4so there is division of DNA going on in part B. Hence, this is not the correct option.
Option C. mitosis- As per the graph DNA molecules decrease from 8 to 4 so there is division of DNA going on in part B. The cells are dividing into daughter cells with half the number of chromosomes passing to each daughter cell. Hence this is not the correct option.
Option D.
Chapter 9 Solutions
EP BIOLOGY 2012-STUDENTWORKS ONLINE
Additional Science Textbook Solutions
Applications and Investigations in Earth Science (9th Edition)
Physics for Scientists and Engineers: A Strategic Approach, Vol. 1 (Chs 1-21) (4th Edition)
College Physics: A Strategic Approach (3rd Edition)
Campbell Biology: Concepts & Connections (9th Edition)
Cosmic Perspective Fundamentals
Organic Chemistry (8th Edition)


- students in a science class investiged the conditions under which corn seeds would germinate most successfully. BAsed on the results which of these factors appears most important for successful corn seed germination.arrow_forwardI want to write the given physician orders in the kardex formarrow_forwardAmino Acid Coclow TABle 3' Gly Phe Leu (G) (F) (L) 3- Val (V) Arg (R) Ser (S) Ala (A) Lys (K) CAG G Glu Asp (E) (D) Ser (S) CCCAGUCAGUCAGUCAG 0204 C U A G C Asn (N) G 4 A AGU C GU (5) AC C UGA A G5 C CUGACUGACUGACUGAC Thr (T) Met (M) lle £€ (1) U 4 G Tyr Σε (Y) U Cys (C) C A G Trp (W) 3' U C A Leu בוט His Pro (P) ££ (H) Gin (Q) Arg 흐름 (R) (L) Start Stop 8. Transcription and Translation Practice: (Video 10-1 and 10-2) A. Below is the sense strand of a DNA gene. Using the sense strand, create the antisense DNA strand and label the 5' and 3' ends. B. Use the antisense strand that you create in part A as a template to create the mRNA transcript of the gene and label the 5' and 3' ends. C. Translate the mRNA you produced in part B into the polypeptide sequence making sure to follow all the rules of translation. 5'-AGCATGACTAATAGTTGTTGAGCTGTC-3' (sense strand) 4arrow_forward
- What is the structure and function of Eukaryotic cells, including their organelles? How are Eukaryotic cells different than Prokaryotic cells, in terms of evolution which form of the cell might have came first? How do Eukaryotic cells become malignant (cancerous)?arrow_forwardWhat are the roles of DNA and proteins inside of the cell? What are the building blocks or molecular components of the DNA and proteins? How are proteins produced within the cell? What connection is there between DNA, proteins, and the cell cycle? What is the relationship between DNA, proteins, and Cancer?arrow_forwardWhy cells go through various types of cell division and how eukaryotic cells control cell growth through the cell cycle control system?arrow_forward
 Human Anatomy & Physiology (11th Edition)BiologyISBN:9780134580999Author:Elaine N. Marieb, Katja N. HoehnPublisher:PEARSON
 Biology 2eBiologyISBN:9781947172517Author:Matthew Douglas, Jung Choi, Mary Ann ClarkPublisher:OpenStax
 Anatomy & PhysiologyBiologyISBN:9781259398629Author:McKinley, Michael P., O'loughlin, Valerie Dean, Bidle, Theresa StouterPublisher:Mcgraw Hill Education,
 Molecular Biology of the Cell (Sixth Edition)BiologyISBN:9780815344322Author:Bruce Alberts, Alexander D. Johnson, Julian Lewis, David Morgan, Martin Raff, Keith Roberts, Peter WalterPublisher:W. W. Norton & Company
 Laboratory Manual For Human Anatomy & PhysiologyBiologyISBN:9781260159363Author:Martin, Terry R., Prentice-craver, CynthiaPublisher:McGraw-Hill Publishing Co.
 Inquiry Into Life (16th Edition)BiologyISBN:9781260231700Author:Sylvia S. Mader, Michael WindelspechtPublisher:McGraw Hill Education