Concept explainers
Videos
NOW TRY THIS
a. In an experiment of tossing a fair die once, what is the sum of the probabilities of all the distinct outcomes in the
b. Does the sum of the probabilities of all the distinct outcomes of any sample space always result in same number?
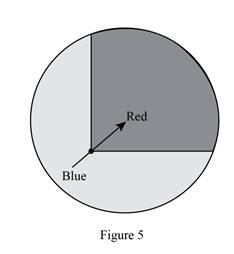
c. What is the probability of the spinner in Figure
a.
To explain:
The sum of all the distinct outcomes in the sample space.
Answer to Problem 1NT
Solution:
The sum of probabilities of all the distinct outcomes in the sample space is always
Explanation of Solution
Given:
A fair die is tossed once.
Approach:
By calculating the probability for each event and taking the sum or by using the result that the sum of probabilities of all the events of sample space is
Calculation:
As on tossing a fair die sample space is
b.
To explain:
Whether the sum of all the probabilities of all the distinct outcomes of any sample space always result in same number.
Answer to Problem 1NT
Solution:
Yes the sum of all the probabilities of all the distinct outcomes of any sample space always result in same number equal to
Explanation of Solution
Approach:
As the probability is the no. of times event happened divided by total events and when the sum is taken for all probabilities it gives
Calculation:
As on tossing a fair die sample space is
c.
To explain:
The probability of spinner landing on Red.
Answer to Problem 1NT
Solution:
The probability of spinner landing on red is nearly
Explanation of Solution
Given:
A following spinner is given:
Approach:
By calculating the area covered by the color Red and taking the probability of it by whole area.
Calculation:
As the area of the Red part is nearly third part of the total area of the circle so the probability of getting red color on spinner is
Want to see more full solutions like this?
Chapter 9 Solutions
Problem Solving Approach to Mathematics for Elementary School Teachers, A, Plus MyLab Math -- Access Card Package (12th Edition)
Additional Math Textbook Solutions
Pathways To Math Literacy (looseleaf)
Finite Mathematics for Business, Economics, Life Sciences and Social Sciences
Elementary Statistics ( 3rd International Edition ) Isbn:9781260092561
Intermediate Algebra (13th Edition)
Introductory Statistics
Elementary Algebra For College Students (10th Edition)


- +6x²+135x+1) (0≤x≤10). a) Find the number of units The total profit P(x) (in thousands of dollars) from a sale of x thousand units of a new product is given by P(x) = In (-x²+6x² + 135x+ that should be sold in order to maximize the total profit. b) What is the maximum profit?arrow_forwardNsjsjsjarrow_forwardlog (6x+5)-log 3 = log 2 - log xarrow_forward
- 1 The ratio of Argan to Potassium from a sample found sample found in Canada is .195 Find The estimated age of the sample A In (1+8.33 (+)) t = (1-26 × 109) en (1 In aarrow_forward7. Find the doubling time of an investment earning 2.5% interest compounded a) semiannually b) continuouslyarrow_forward6. Find the time it will take $1000 to grow to $5000 at an interest rate of 3.5% if the interest is compounded a) quarterly b) continuouslyarrow_forward
- A smallish urn contains 16 small plastic bunnies - 9 of which are pink and 7 of which are white. 10 bunnies are drawn from the urn at random with replacement, and X is the number of pink bunnies that are drawn. (a) P(X=6)[Select] (b) P(X>7) ≈ [Select]arrow_forward. Find how many years it takes for $1786 to grow to $2063 if invested at 2.6% annual interest compounded monthly. 12+arrow_forwardK=3, Gauss Seidel Fill in only 4 decimal places here in Canvas. Make sure in exam and homework, 6 decimal places are required. X1 = X2 = X3 =arrow_forward
- A smallish urn contains 25 small plastic bunnies - 7 of which are pink and 18 of which are white. 10 bunnies are drawn from the urn at random with replacement, and X is the number of pink bunnies that are drawn. (a) P(X = 5)=[Select] (b) P(X<6) [Select]arrow_forwardThe fox population in a certain region has an annual growth rate of 8 percent per year. It is estimated that the population in the year 2000 was 22600. (a) Find a function that models the population t years after 2000 (t = 0 for 2000). Your answer is P(t) = (b) Use the function from part (a) to estimate the fox population in the year 2008. Your answer is (the answer should be an integer)arrow_forwardrarrow_forward

 Algebra and Trigonometry (MindTap Course List)AlgebraISBN:9781305071742Author:James Stewart, Lothar Redlin, Saleem WatsonPublisher:Cengage Learning
 Holt Mcdougal Larson Pre-algebra: Student Edition...AlgebraISBN:9780547587776Author:HOLT MCDOUGALPublisher:HOLT MCDOUGAL
 College Algebra (MindTap Course List)AlgebraISBN:9781305652231Author:R. David Gustafson, Jeff HughesPublisher:Cengage Learning
 College AlgebraAlgebraISBN:9781305115545Author:James Stewart, Lothar Redlin, Saleem WatsonPublisher:Cengage Learning