
Concept explainers
Videos
Tuition Costs Average annual tuition and fees for in-state students at public four-year colleges are shown in the table for selected years and graphed as ordered pairs of points, where
| Tuition and Fees | |
| Year | Cost (in dollars) |
| 2005 | 5492 |
| 2006 | 5804 |
| 2007 | 6191 |
| 2008 | 6591 |
| 2009 | 7050 |
| 2010 | 7605 |
Source: Trends in College Pricing2010, The College Board.
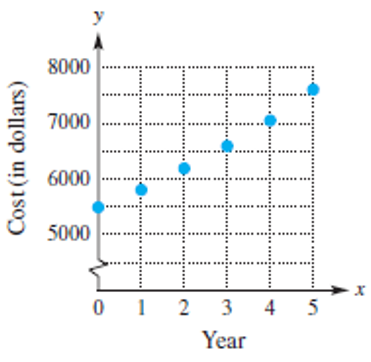
(a) Use the points from the years 2005 and 2010 to find a linear function f that models the data.
(b) Use the function from part (a) to estimate the cost of tuition and fees, to the nearest dollar, at public four-year colleges in 2012.
Want to see the full answer?
Check out a sample textbook solution
Chapter 8 Solutions
Mathematical Ideas with Integrated Review and Worksheets plus NEW MyLab Math with Pearson eText -- Access Card Package (Integrated Review Courses in MyLab Math and MyLab Statistics)


- Table 6 shows the year and the number ofpeople unemployed in a particular city for several years. Determine whether the trend appears linear. If so, and assuming the trend continues, in what year will the number of unemployed reach 5 people?arrow_forwardA realtor studies the relationship between the size of a house (in square feet) and the property taxes (in $) owed by the owner. The table below shows a portion of the data for 20 homes in a suburb 60 miles outside of New York City. [You may find it useful to reference the t table.] Property Taxes Size 21,872 2,464 17,498 2,451 ⋮ ⋮ 29,294 2,895 Click here for the Excel Data File a-1. Calculate the sample correlation coefficient rxy. (Round intermediate calculations to at least 4 decimal places and final answers to 4 decimal places.) a-2. Interpret rxy. multiple choice 1 The correlation coefficient indicates a positive linear relationship. The correlation coefficient indicates a negative linear relationship. The correlation coefficient indicates no linear relationship. b. Specify the competing hypotheses in order to determine whether the population correlation coefficient between the size of a…arrow_forwardWhat type of graph is this, and is it displaying Ordinal, Interval, Nominal, or Ratio Data?arrow_forward
- With aging, body fat increases and muscle mass declines. The line graphs show the percent body fat in adult females and males as they age from 25 to 75 years. Use this information to complete parts (a) through (c) below. a. Find an estimate for the percent body fat in 45-year-old females. % (Type a whole number.) Percent Body Fat 40 36- 32- 28- 24 20+ 15 Percent Body Fat in Adults 25 35 45 Age Females Males 55 65 75arrow_forwardThe line graph below shows the average US price for one gallon of gasoline on the first Monday of each month from January 2008 to October 2011. Price (Dollars per Gallon) 4.00 3.50 3.00 2.50 2.00 1.50 8 1.00 0.50 Average Monthly U.S. Regular Gasoline Prices January, 2008 March, 2008 May, 2008 July, 2008 2008 September, 2008 November, 6002 Auenuer 2009 2009 March, 2009 2010 May, 2009 July, 2009 January, 2010 March, 2010 May, 2010 July, 2010 September, 2010 November, September, November, January, 2011 March, 2011 July, 2011 May, 2011 September, 2011 What was the relative change in the price of a gallon of gasoline from July 2008 to January 2009? Round to the nearest tenth of a percent. Remember (E-B)/Barrow_forwardExample Estimate the profits for the year 2011 from the data given below: Year 2009 2010 2011 Profit · 8.5 12 10arrow_forward
- draw a line graph following this information. The line graph depicts the historical and projected sales volume of Pepsi Co Jamaica's Diet Pepsi for the next fiscal year, with the horizontal axis representing the four quarters of the year, and the vertical axis representing the sales volume in million cases. The historical sales data is represented by a line that shows a sales volume of 1 million cases for the past fiscal year. The projected sales volume is represented by another line that shows an expected increase in sales volume to 1.5 million cases for the next fiscal year. The sales targets for each quarter are represented by markers or points on the graph, with the first quarter expected to reach 0.4 million cases, the second quarter at 0.5 million cases, the third quarter at 0.3 million cases, and the fourth quarter at 0.3 million cases.arrow_forwardEstimating Useful Life and Percent Used UpThe property and equipment footnote from the Deere & Company Equipment and Operations segment follows.Property and Depreciation A summary of property and equipment at October 31 follows. Useful Lives* Property and Equipment ($ millions) (Years) 2015 2014 Land $114 $120 Buildings and building equipment 23 2,794 3,037 Machinery and equipment 11 4,833 5,089 Dies, patterns, tools, etc 8 1,567 1,552 All other 5 875 889 Construction in progress 345 530 Total at cost 10,528 11,217 Less accumulated depreciation 5,846 5,694 Total $4,682 $5,523 *Weighted averages Total property and equipment additions in 2015, 2014 and 2013 were $666 million, $1,016 million and $1,158 million, and depreciation was $692 million, $696 million and $637 million, respectively.a. Compute the average useful life of Deere’s depreciable assets at year-end 2015. Round answer to one decimal place.Answer years…arrow_forwardCreate a line graph of the data using Excel. For how many of the years was the deficit greater than or equal to $320 million?arrow_forward
- Number 6arrow_forwardThe double-bar graph shown displays the average cost of an undergraduate student's tuition, fees, and room and board for the academic years 2012-2013 to 2016-2017 at both a 2-year and a 4-year public institution. In which academic year was there the smallest difference between the average costs at a 2-year institution and a 4-year institution? 350+ 2-year 4-year 300- 248 253 257 250- 239 242 200- 150- 99 103 105 107 95 100- 50- 2012-13 2013-14 2014-15 2015-16 Academic year 2016-17 ..... In the academic year, the difference between the average cost at the 2-year and the 4-year institution was the smallest. 2016-17 2015-16 2012-13 2013-14 2014-15 Average Cost (in hundreds of dollars)arrow_forward

 Mathematics For Machine TechnologyAdvanced MathISBN:9781337798310Author:Peterson, John.Publisher:Cengage Learning,
 Algebra and Trigonometry (MindTap Course List)AlgebraISBN:9781305071742Author:James Stewart, Lothar Redlin, Saleem WatsonPublisher:Cengage Learning
 Glencoe Algebra 1, Student Edition, 9780079039897...AlgebraISBN:9780079039897Author:CarterPublisher:McGraw Hill
 College Algebra (MindTap Course List)AlgebraISBN:9781305652231Author:R. David Gustafson, Jeff HughesPublisher:Cengage Learning
 College AlgebraAlgebraISBN:9781305115545Author:James Stewart, Lothar Redlin, Saleem WatsonPublisher:Cengage Learning