
(a)
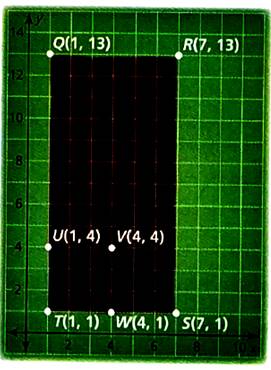
To find: The area of garden
(a)
Answer to Problem 28E
The areas of garden is
Explanation of Solution
Given information: The following figure is been given:

Formula used:
Calculation: The area of the garden will be:
(b)
To find: The number of Zucchini plants that you can plant.
(b)
Answer to Problem 28E
The number of plant is 8.
Explanation of Solution
Given information: Each plant of Zucchini requires
The following figure is been given:
Calculation: Since each plant take
Hence,
(c)
To find: The number of each vegetable that can you plant in the area
(c)
Answer to Problem 28E
The numbers of each plant that can be planted in area
Explanation of Solution
Given information: The following figure is been given:

Calculation:
Area for Lettuce
Hence the number of the Lettuce,
Similarly for Zucchini
Chapter 8 Solutions
BIG IDEAS MATH Integrated Math 1: Student Edition 2016

- 25.2. Find the Laurent series for the function 1/[z(z-1)] in the follow- ing domains: (a). 0<|z|< 1, (b). 1<|z, (c). 0arrow_forward25.5. Find the Laurent series for the function 1/[(z - 1)(-2)(z - 3)] in the following domains: (a). 0 3. شهریarrow_forward25.1. Expand each of the following functions f(z) in a Laurent series on the indicated domain: (a). z² - 2z+5 (2-2)(z² + 1)' (c). Log za 2 b (z - موجود 11, 29, where b>a> 1 are real, |z| > b.arrow_forward25.3. Find the Laurent series for the function z/[(22 + 1)(z² + 4)] in the following domains (a). 02.arrow_forward25.2. Find the Laurent series for the function 1/[z(z-1)] in the follow- ing domains: (a). 0<|z|< 1, (b). 1 <|z|, (c). 0<|z1|< 1, (d). 1< |z1|, (e). 1<|z2|<2.arrow_forward25.1. Expand each of the following functions f(z) in a Laurent series on the indicated domain: 22-2z+5 (z - 2) (z² + 1)' (z 11, 22 (a). (c). Log (2-8) where b>a> 1 are real, |z|> b. barrow_forward25.5. Find the Laurent series for the function 1/[(2-1)(z-2)(z-3)] in the following domains: (a). 0 3.arrow_forwardCan you explain how the error term in the CF Algorithm relates to the (m+1)th complete quotient? Also, what would be a good way to explain the connection between these two slides? How can one transition between them for a presentation?arrow_forwardHow can I explain the pi example in a presentation? I'm having trouble transitioning between these two slidesarrow_forwardMcGilla Golf has decided to sell a new line of golf clubs. The clubs will sell for $895 per set and have a variable cost of $431 per set. The company has spent $200,000 for a marketing study that determined the company will sell 80,000 sets per year for seven years. The marketing study also determined that the company will lose sales of 8,600 sets per year of its high-priced clubs. The high-priced clubs sell at $1,325 and have variable costs of $645. The company will also increase sales of its cheap clubs by 10,800 sets per year. The cheap clubs sell for $340 and have variable costs of $141 per set. The fixed costs each year will be $14,350,000. The company has also spent $1,500,000 on research and development for the new clubs. The plant and equipment required will cost $43,700,000 and will be depreciated on a straight-line basis. The new clubs will also require an increase in net working capital of $3,625,000 that will be returned at the end of the project. The tax rate is 25…arrow_forwardYou have been hired as an intern to run analyses on the data and report the results back to Sarah; the five questions that Sarah needs you to address are given below. Does there appear to be a positive or negative relationship between price and screen size? Use a scatter plot to examine the relationship. Determine and interpret the correlation coefficient between the two variables. In your interpretation, discuss the direction of the relationship (positive, negative, or zero relationship). Also discuss the strength of the relationship. Estimate the relationship between screen size and price using a simple linear regression model and interpret the estimated coefficients. (In your interpretation, tell the dollar amount by which price will change for each unit of increase in screen size). Include the manufacturer dummy variable (Samsung=1, 0 otherwise) and estimate the relationship between screen size, price and manufacturer dummy as a multiple linear regression model. Interpret the…arrow_forwardDoes there appear to be a positive or negative relationship between price and screen size? Use a scatter plot to examine the relationship. How to take snapshots: if you use a MacBook, press Command+ Shift+4 to take snapshots. If you are using Windows, use the Snipping Tool to take snapshots. Question 1: Determine and interpret the correlation coefficient between the two variables. In your interpretation, discuss the direction of the relationship (positive, negative, or zero relationship). Also discuss the strength of the relationship. Value of correlation coefficient: Direction of the relationship (positive, negative, or zero relationship): Strength of the relationship (strong/moderate/weak): Question 2: Estimate the relationship between screen size and price using a simple linear regression model and interpret the estimated coefficients. In your interpretation, tell the dollar amount by which price will change for each unit of increase in screen size. (The answer for the…arrow_forwardarrow_back_iosSEE MORE QUESTIONSarrow_forward_ios
 Discrete Mathematics and Its Applications ( 8th I...MathISBN:9781259676512Author:Kenneth H RosenPublisher:McGraw-Hill Education
 Mathematics for Elementary Teachers with Activiti...MathISBN:9780134392790Author:Beckmann, SybillaPublisher:PEARSON
 Thinking Mathematically (7th Edition)MathISBN:9780134683713Author:Robert F. BlitzerPublisher:PEARSON
 Discrete Mathematics With ApplicationsMathISBN:9781337694193Author:EPP, Susanna S.Publisher:Cengage Learning,
 Pathways To Math Literacy (looseleaf)MathISBN:9781259985607Author:David Sobecki Professor, Brian A. MercerPublisher:McGraw-Hill Education