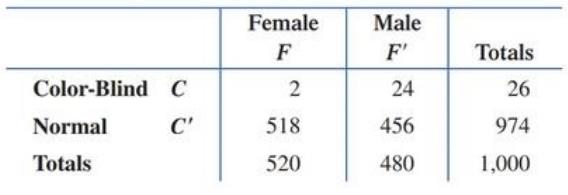
Genetics. In a study to determine frequency and dependency of color-blindness relative to females and males, 1 , 000 people were chosen at random, and the following results were recorded: (A) Convert this table to a probability table by dividing each entry by 1 , 000 . (B) What is the probability that a person is a woman, given that the person is color-blind? Are the events color blindness and female independent? (C) What is the probability that a person is color-blind, given that the person is a male? Are the events color-blindness and male independent?
Genetics. In a study to determine frequency and dependency of color-blindness relative to females and males, 1 , 000 people were chosen at random, and the following results were recorded: (A) Convert this table to a probability table by dividing each entry by 1 , 000 . (B) What is the probability that a person is a woman, given that the person is color-blind? Are the events color blindness and female independent? (C) What is the probability that a person is color-blind, given that the person is a male? Are the events color-blindness and male independent?
Solution Summary: The author calculates the probability table by dividing each entry by 1,000.
Genetics. In a study to determine frequency and dependency of color-blindness relative to females and males,
1
,
000
people were chosen at random, and the following results were recorded:
(A) Convert this table to a probability table by dividing each entry by
1
,
000
.
(B) What is the probability that a person is a woman, given that the person is color-blind? Are the events color blindness and female independent?
(C) What is the probability that a person is color-blind, given that the person is a male? Are the events color-blindness and male independent?
2.2, 13.2-13.3)
question: 5 point(s) possible
ubmit test
The accompanying table contains the data for the amounts (in oz) in cans of a certain soda. The cans are labeled to indicate that the contents are 20 oz of soda. Use the sign test and
0.05 significance level to test the claim that cans of this soda are filled so that the median amount is 20 oz. If the median is not 20 oz, are consumers being cheated?
Click the icon to view the data.
What are the null and alternative hypotheses?
OA. Ho: Medi
More Info
H₁: Medi
OC. Ho: Medi
H₁: Medi
Volume (in ounces)
20.3
20.1
20.4
Find the test stat
20.1
20.5
20.1
20.1
19.9
20.1
Test statistic =
20.2
20.3
20.3
20.1
20.4
20.5
Find the P-value
19.7
20.2
20.4
20.1
20.2
20.2
P-value=
(R
19.9
20.1
20.5
20.4
20.1
20.4
Determine the p
20.1
20.3
20.4
20.2
20.3
20.4
Since the P-valu
19.9
20.2
19.9
Print
Done
20 oz
20 oz
20 oz
20 oz
ce that the consumers are being cheated.
T
Teenage obesity (O), and weekly fast-food meals (F), among some selected Mississippi teenagers are:
Name Obesity (lbs) # of Fast-foods per week
Josh
185
10
Karl
172
8
Terry
168
9
Kamie
Andy
204
154
12
6
(a) Compute the variance of Obesity, s²o, and the variance of fast-food meals, s², of this data. [Must show full work].
(b) Compute the Correlation Coefficient between O and F. [Must show full work].
(c) Find the Coefficient of Determination between O and F. [Must show full work].
(d) Obtain the Regression equation of this data. [Must show full work].
(e) Interpret your answers in (b), (c), and (d). (Full explanations required).
Edit View Insert Format Tools Table
H.w
WI
M
Wz
dy
A
Sindax
Sind ①dlmax
У тах
at 0.75m from A
W=6KN/M L=2
W2 = 9 KN/m
P= 10 KN
B
Chapter 8 Solutions
Finite Mathematics for Business, Economics, Life Sciences, and Social Sciences (13th Edition)
Need a deep-dive on the concept behind this application? Look no further. Learn more about this topic, subject and related others by exploring similar questions and additional content below.


 Holt Mcdougal Larson Pre-algebra: Student Edition...AlgebraISBN:9780547587776Author:HOLT MCDOUGALPublisher:HOLT MCDOUGAL
 Algebra and Trigonometry (MindTap Course List)AlgebraISBN:9781305071742Author:James Stewart, Lothar Redlin, Saleem WatsonPublisher:Cengage Learning
 College AlgebraAlgebraISBN:9781305115545Author:James Stewart, Lothar Redlin, Saleem WatsonPublisher:Cengage Learning