Concept explainers
a.
To draw:
A coordinate plane for each column, and graph the equations in the column on that plane.
a.
Explanation of Solution
Given:
You use a combination of running and walking to complete a race dmiles long. Your running speed is r miles per hour and your walking speed is w miles per hour. Let x be your running time and let y be your walking time (both in hours). Then
The table below shows equations of the form
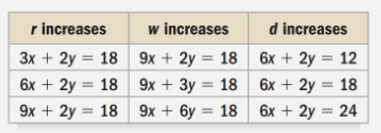
Calculation:
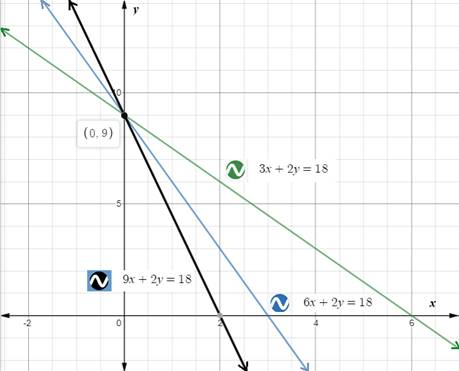
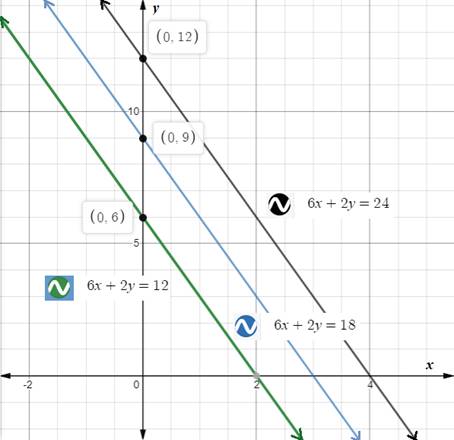
Upon graphing the equation in 1st column, we will get our required graph as:
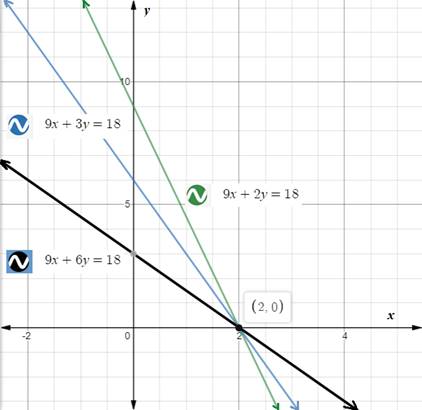
Upon graphing the equation in 2ndcolumn, we will get our required graph as:
Upon graphing the equation in 3rdcolumn, we will get our required graph as:
b.
What happens to the graph of
b.
Answer to Problem 32E
The graph of
Explanation of Solution
Given:
You use a combination of running and walking to complete a race dmiles long. Your running speed is r miles per hour and your walking speed is w miles per hour. Let x be your running time and let y be your walking time (both in hours). Then
The table below shows equations of the form
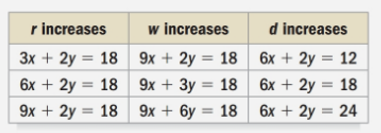
Calculation:
Upon looking at the graph of equations in 1st column, we can see that graph of
c.
What happens to the graph of
c.
Answer to Problem 32E
The graph of
Explanation of Solution
Given:
You use a combination of running and walking to complete a race dmiles long. Your running speed is r miles per hour and your walking speed is w miles per hour. Let x be your running time and let y be your walking time (both in hours). Then
The table below shows equations of the form
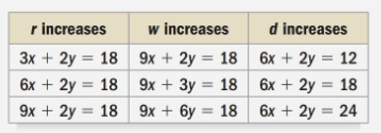
Calculation:
Upon looking at the graph of equations in 2nd column, we can see that the y -intercept of the graph of
d.
What happens to the graph of
d.
Answer to Problem 32E
Thegraph of
Explanation of Solution
Given:
You use a combination of running and walking to complete a race dmiles long. Your running speed is r miles per hour and your walking speed is w miles per hour. Let x be your running time and let y be your walking time (both in hours). Then
The table below shows equations of the form
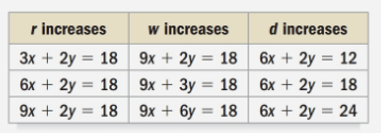
Calculation:
Upon looking at the graph of equations in 3rd column, we can see that the graph of
Chapter 8 Solutions
Pre-Algebra
Additional Math Textbook Solutions
Calculus: Early Transcendentals (2nd Edition)
University Calculus: Early Transcendentals (4th Edition)
A Problem Solving Approach To Mathematics For Elementary School Teachers (13th Edition)
Calculus for Business, Economics, Life Sciences, and Social Sciences (14th Edition)
Elementary Statistics (13th Edition)
Thinking Mathematically (6th Edition)
- Please Help me answer this linear algebra question. This is a practice textbook question.arrow_forward1. a scientist observed a bacterium in a microscope. it measured about .0000029 meter in diameter which of the following is closest to it? A- 2 x 10^-6, B- 2 x 10^-5, C- 3 x 10^-5, or D- 3 x 10^-6 2.express the product of 500 and 400 in scientific notation. is it 2 x 10^5 or 2 x 10^4 or 2 x 10^3 or 20 x 10^4arrow_forwardPlease Help me answer this linear algebra question. This is a practice textbook question.arrow_forward
- Please Help me answer this linear algebra question. This is a practice textbook question.arrow_forwardTY D om E h om ng 00 C B A G F Q ו 3 13 Details Find an Euler path for the graph. Enter your response as a sequence of vertices in the order they are visited, for example, ABCDEA. fic ► Question Help: Video Message instructor Submit Question tor arch 園 A Wind advisoryarrow_forwardYou are provided with three 2D data points, p1, p2 and p3. Solving A C = B for C provides youwith the coefficients of a natural cubic spline curve that interpolates these points.Additionally, you have been given A and B, but some elements are missing. Moreover, the last two rowsof A are entirely absent. Your task is to determine and fill in the missing elements. For the last two rows,enforce a zero tangent at the beginning (in p1) and a not-a-knot boundary condition in p2. The matricesA and B are given as follows:Explain how to find the entries of A and B . How would you adapt these matrices if the data pointswere 3D? What if your spline should go through five data points? How many “extra rows” would there thenbe (with “extra” meaning “in addition to securing C2-continuity”)?arrow_forward
- Which graph represents f(x) = √x-2+3?arrow_forwardPractice Assignment 5.6 Rational Functions M Practice Assig Practice Assignment 5.6 Rational Functions Score: 120/150 Answered: 12/15 Question 10 A Write an equation for the function graphed below 5 + 4 1 2 H + + -7 -6 -5 -4 -3 -2 -1 2 34567 | -2 ర y = Question Help: Video Message instructor Post to forum Submit Questionarrow_forwardit's not algebra 4th gradearrow_forward
 Algebra and Trigonometry (6th Edition)AlgebraISBN:9780134463216Author:Robert F. BlitzerPublisher:PEARSON
 Contemporary Abstract AlgebraAlgebraISBN:9781305657960Author:Joseph GallianPublisher:Cengage Learning
 Linear Algebra: A Modern IntroductionAlgebraISBN:9781285463247Author:David PoolePublisher:Cengage Learning
 Algebra And Trigonometry (11th Edition)AlgebraISBN:9780135163078Author:Michael SullivanPublisher:PEARSON
 Introduction to Linear Algebra, Fifth EditionAlgebraISBN:9780980232776Author:Gilbert StrangPublisher:Wellesley-Cambridge Press
 College Algebra (Collegiate Math)AlgebraISBN:9780077836344Author:Julie Miller, Donna GerkenPublisher:McGraw-Hill Education


