
Concept explainers
Videos
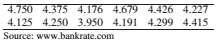
Mortgage rates: Following are interest rates (annual percentage rates) for a 30-year fixed rate mortgage from a sample of lenders in Macon. Georgia on June 20. 2013. It is reasonable to assume that the population is approximately normal.
- Construct a 99 confidence interval for the
mean rate. - One week earlier. The mean rate was 4.050%. A mortgage broker claims that the mean rate is now higher. Based on the confidence interest. Is this a reasonable claim? Explain.
(a)
>The
Answer to Problem 32E
From the above MINITAB output, the
Explanation of Solution
Given information:
Following are interest rates (annual percentage rates) for a
|
|
|
|
|
|
|
Population is normally distributed.
Calculation:
MINITAB is used to construct
MINITAB procedure:
Step
Step
Step
Step
Step
Step
MINITAB output:
One-Sample
From the above MINITAB output, the
(b)
>Whether claim made in the problem statement is contradictory to the confidence interval.
Answer to Problem 32E
No, it is a reasonable claim.
Explanation of Solution
Given information:
Following are interest rates (annual percentage rates) for a
|
|
|
|
|
|
|
Population is normally distributed.
One week earlier the mean rate was
A claim is made by broker that the mean rate is now higher.
Calculation:
From part
Since this interval does contain the value
Want to see more full solutions like this?
Chapter 8 Solutions
Elementary Statistics (Text Only)


- A marketing agency wants to determine whether different advertising platforms generate significantly different levels of customer engagement. The agency measures the average number of daily clicks on ads for three platforms: Social Media, Search Engines, and Email Campaigns. The agency collects data on daily clicks for each platform over a 10-day period and wants to test whether there is a statistically significant difference in the mean number of daily clicks among these platforms. Conduct ANOVA test. You can provide your answer by inserting a text box and the answer must include: also please provide a step by on getting the answers in excel Null hypothesis, Alternative hypothesis, Show answer (output table/summary table), and Conclusion based on the P value.arrow_forwardA company found that the daily sales revenue of its flagship product follows a normal distribution with a mean of $4500 and a standard deviation of $450. The company defines a "high-sales day" that is, any day with sales exceeding $4800. please provide a step by step on how to get the answers Q: What percentage of days can the company expect to have "high-sales days" or sales greater than $4800? Q: What is the sales revenue threshold for the bottom 10% of days? (please note that 10% refers to the probability/area under bell curve towards the lower tail of bell curve) Provide answers in the yellow cellsarrow_forwardBusiness Discussarrow_forward
 Glencoe Algebra 1, Student Edition, 9780079039897...AlgebraISBN:9780079039897Author:CarterPublisher:McGraw Hill
 Big Ideas Math A Bridge To Success Algebra 1: Stu...AlgebraISBN:9781680331141Author:HOUGHTON MIFFLIN HARCOURTPublisher:Houghton Mifflin Harcourt