
STATISTICS F/BUSINESS+ECONOMICS-TEXT
13th Edition
ISBN: 9781305881884
Author: Anderson
Publisher: CENGAGE L
expand_more
expand_more
format_list_bulleted
Concept explainers
Videos
Textbook Question
Chapter 8.2, Problem 17E
The International Air Transport Association surveys business travelers to develop quality ratings for transatlantic gateway airports. The maximum possible rating is 10. Suppose a simple random sample of 50 business travelers is selected and each traveler is asked to provide a rating for the Miami International Airport. The ratings obtained from the sample of 50 business travelers follow.
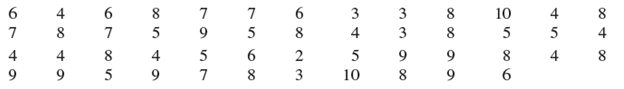
Develop a 95% confidence
Expert Solution & Answer

Trending nowThis is a popular solution!

Students have asked these similar questions
Techniques QUAT6221 2025 PT B...
TM
Tabudi Maphoru
Activities Assessments Class Progress lIE Library • Help v
The table below shows the prices (R) and quantities (kg) of rice, meat and potatoes items bought during 2013 and 2014:
2013
2014
P1Qo
PoQo
Q1Po P1Q1
Price
Ро
Quantity
Qo
Price
P1
Quantity
Q1
Rice
7
80
6
70
480
560
490
420
Meat
30
50
35
60
1 750
1 500
1 800
2 100
Potatoes
3
100
3
100
300
300
300
300
TOTAL
40
230
44
230
2 530
2 360
2 590
2 820
Instructions:
1 Corall dawn to tha bottom of thir ceraan urina se se tha haca nariad in archerca antarand cubmit
Q Search
ENG US
口X
2025/05
The table below indicates the number of years of experience of a sample of employees who work on a particular production line and the corresponding number of units of a good that each employee produced last month.
Years of Experience (x)
Number of Goods (y)
11
63
5
57
1
48
4
54
45
3
51
Q.1.1 By completing the table below and then applying the relevant formulae, determine the line of best fit for this bivariate data set.
Do NOT change the units for the variables.
X
y
X2
xy
Ex=
Ey=
EX2
EXY=
Q.1.2 Estimate the number of units of the good that would have been produced last month by an employee with 8 years of experience.
Q.1.3 Using your calculator, determine the coefficient of correlation for the data set.
Interpret your answer.
Q.1.4 Compute the coefficient of determination for the data set.
Interpret your answer.
Q.3.2 A sample of consumers was asked to name their favourite fruit. The results regarding the popularity of the different fruits are given in the following table.
Type of Fruit
Number of Consumers
Banana
25
Apple
20
Orange
5
TOTAL
50
Draw a bar chart to graphically illustrate the results given in the table.
Chapter 8 Solutions
STATISTICS F/BUSINESS+ECONOMICS-TEXT
Ch. 8.1 - A simple random sample of 40 items resulted in a...Ch. 8.1 - A simple random sample of 50 items from a...Ch. 8.1 - A simple random sample of 60 items resulted in a...Ch. 8.1 - A 95% confidence interval for a population mean...Ch. 8.1 - Data were collected on the amount spent by 64...Ch. 8.1 - In an attempt to assess total daily travel taxes...Ch. 8.1 - The average annual cost of the first year of...Ch. 8.1 - Studies show that massage therapy has a variety of...Ch. 8.1 - The mean cost to repair the smoke and fire damage...Ch. 8.1 - Costs are rising for all kinds of medical care....
Ch. 8.2 - For a t distribution with 16 degrees of freedom,...Ch. 8.2 - Find the t value(s) for each of the following...Ch. 8.2 - The following sample data are from a normal...Ch. 8.2 - A simple random sample with n = 54 provided a...Ch. 8.2 - Sales personnel for Skillings Distributors submit...Ch. 8.2 - A sample containing years to maturity and yield...Ch. 8.2 - The International Air Transport Association...Ch. 8.2 - Older people often have a hard time finding work....Ch. 8.2 - The mean cost of a meal for two in a mid-range...Ch. 8.2 - The average annual premium for automobile...Ch. 8.2 - Health insurers are beginning to offer...Ch. 8.2 - Marvel Studios motion picture Guardians of the...Ch. 8.3 - How large a sample should be selected to provide a...Ch. 8.3 - The range for a set of data is estimated to be 36....Ch. 8.3 - Refer to the Scheer Industries example in Section...Ch. 8.3 - The U.S. Energy Information Administration (US...Ch. 8.3 - Annual starting salaries for college graduates...Ch. 8.3 - Many medical professionals believe that eating too...Ch. 8.3 - Customers arrive at a movie theater at the...Ch. 8.3 - There has been a trend toward less driving in the...Ch. 8.4 - A simple random sample of 400 individuals provides...Ch. 8.4 - A simple random sample of 800 elements generates a...Ch. 8.4 - In a survey, the planning value for the population...Ch. 8.4 - At 95% confidence, how large a sample should be...Ch. 8.4 - The Consumer Reports National Research Center...Ch. 8.4 - According to statistics reported on CNBC, a...Ch. 8.4 - One of the questions on a survey of 1000 adults...Ch. 8.4 - According to Franchise business review, over 50%...Ch. 8.4 - In 16% of all homes with a stay-at-home parent,...Ch. 8.4 - For many years businesses have struggled with the...Ch. 8.4 - Fewer young people are driving. In 1983, 87% of...Ch. 8.4 - A poll for the presidential campaign sampled 491...Ch. 8.4 - The Pew Research Center Internet Project,...Ch. 8 - A sample survey of 54 discount brokers showed that...Ch. 8 - A survey conducted by the American Automobile...Ch. 8 - The 92 million Americans of age 50 and over...Ch. 8 - Russia has recently started a push for stronger...Ch. 8 - The Health Care Cost Institute tracks health care...Ch. 8 - A recent article reported that there are...Ch. 8 - Mileage tests are conducted for a particular model...Ch. 8 - In developing patient appointment schedules, a...Ch. 8 - Annual salary plus bonus data for chief executive...Ch. 8 - The National Center for Education Statistics...Ch. 8 - A USA Today/CNN/Gallup survey of 369 working...Ch. 8 - The Pew Research Center has conducted extensive...Ch. 8 - A survey of 750 likely voters in Ohio was...Ch. 8 - The Centers for Disease Control reported the...Ch. 8 - A well-known bank credit card firm wishes to...Ch. 8 - Workers in several industries were surveyed to...Ch. 8 - Although airline schedules and cost are important...Ch. 8 - Young Professional Magazine Young Professional...Ch. 8 - Gulf Real Estate Properties Gulf Real Estate...Ch. 8 - Metropolitan Research, Inc. Metropolitan Research,...
Knowledge Booster


Learn more about
Need a deep-dive on the concept behind this application? Look no further. Learn more about this topic, statistics and related others by exploring similar questions and additional content below.Similar questions
- Q.2.3 The probability that a randomly selected employee of Company Z is female is 0.75. The probability that an employee of the same company works in the Production department, given that the employee is female, is 0.25. What is the probability that a randomly selected employee of the company will be female and will work in the Production department? Q.2.4 There are twelve (12) teams participating in a pub quiz. What is the probability of correctly predicting the top three teams at the end of the competition, in the correct order? Give your final answer as a fraction in its simplest form.arrow_forwardQ.2.1 A bag contains 13 red and 9 green marbles. You are asked to select two (2) marbles from the bag. The first marble selected will not be placed back into the bag. Q.2.1.1 Construct a probability tree to indicate the various possible outcomes and their probabilities (as fractions). Q.2.1.2 What is the probability that the two selected marbles will be the same colour? Q.2.2 The following contingency table gives the results of a sample survey of South African male and female respondents with regard to their preferred brand of sports watch: PREFERRED BRAND OF SPORTS WATCH Samsung Apple Garmin TOTAL No. of Females 30 100 40 170 No. of Males 75 125 80 280 TOTAL 105 225 120 450 Q.2.2.1 What is the probability of randomly selecting a respondent from the sample who prefers Garmin? Q.2.2.2 What is the probability of randomly selecting a respondent from the sample who is not female? Q.2.2.3 What is the probability of randomly…arrow_forwardTest the claim that a student's pulse rate is different when taking a quiz than attending a regular class. The mean pulse rate difference is 2.7 with 10 students. Use a significance level of 0.005. Pulse rate difference(Quiz - Lecture) 2 -1 5 -8 1 20 15 -4 9 -12arrow_forward
- The following ordered data list shows the data speeds for cell phones used by a telephone company at an airport: A. Calculate the Measures of Central Tendency from the ungrouped data list. B. Group the data in an appropriate frequency table. C. Calculate the Measures of Central Tendency using the table in point B. D. Are there differences in the measurements obtained in A and C? Why (give at least one justified reason)? I leave the answers to A and B to resolve the remaining two. 0.8 1.4 1.8 1.9 3.2 3.6 4.5 4.5 4.6 6.2 6.5 7.7 7.9 9.9 10.2 10.3 10.9 11.1 11.1 11.6 11.8 12.0 13.1 13.5 13.7 14.1 14.2 14.7 15.0 15.1 15.5 15.8 16.0 17.5 18.2 20.2 21.1 21.5 22.2 22.4 23.1 24.5 25.7 28.5 34.6 38.5 43.0 55.6 71.3 77.8 A. Measures of Central Tendency We are to calculate: Mean, Median, Mode The data (already ordered) is: 0.8, 1.4, 1.8, 1.9, 3.2, 3.6, 4.5, 4.5, 4.6, 6.2, 6.5, 7.7, 7.9, 9.9, 10.2, 10.3, 10.9, 11.1, 11.1, 11.6, 11.8, 12.0, 13.1, 13.5, 13.7, 14.1, 14.2, 14.7, 15.0, 15.1, 15.5,…arrow_forwardPEER REPLY 1: Choose a classmate's Main Post. 1. Indicate a range of values for the independent variable (x) that is reasonable based on the data provided. 2. Explain what the predicted range of dependent values should be based on the range of independent values.arrow_forwardIn a company with 80 employees, 60 earn $10.00 per hour and 20 earn $13.00 per hour. Is this average hourly wage considered representative?arrow_forward
- The following is a list of questions answered correctly on an exam. Calculate the Measures of Central Tendency from the ungrouped data list. NUMBER OF QUESTIONS ANSWERED CORRECTLY ON AN APTITUDE EXAM 112 72 69 97 107 73 92 76 86 73 126 128 118 127 124 82 104 132 134 83 92 108 96 100 92 115 76 91 102 81 95 141 81 80 106 84 119 113 98 75 68 98 115 106 95 100 85 94 106 119arrow_forwardThe following ordered data list shows the data speeds for cell phones used by a telephone company at an airport: A. Calculate the Measures of Central Tendency using the table in point B. B. Are there differences in the measurements obtained in A and C? Why (give at least one justified reason)? 0.8 1.4 1.8 1.9 3.2 3.6 4.5 4.5 4.6 6.2 6.5 7.7 7.9 9.9 10.2 10.3 10.9 11.1 11.1 11.6 11.8 12.0 13.1 13.5 13.7 14.1 14.2 14.7 15.0 15.1 15.5 15.8 16.0 17.5 18.2 20.2 21.1 21.5 22.2 22.4 23.1 24.5 25.7 28.5 34.6 38.5 43.0 55.6 71.3 77.8arrow_forwardIn a company with 80 employees, 60 earn $10.00 per hour and 20 earn $13.00 per hour. a) Determine the average hourly wage. b) In part a), is the same answer obtained if the 60 employees have an average wage of $10.00 per hour? Prove your answer.arrow_forward
- The following ordered data list shows the data speeds for cell phones used by a telephone company at an airport: A. Calculate the Measures of Central Tendency from the ungrouped data list. B. Group the data in an appropriate frequency table. 0.8 1.4 1.8 1.9 3.2 3.6 4.5 4.5 4.6 6.2 6.5 7.7 7.9 9.9 10.2 10.3 10.9 11.1 11.1 11.6 11.8 12.0 13.1 13.5 13.7 14.1 14.2 14.7 15.0 15.1 15.5 15.8 16.0 17.5 18.2 20.2 21.1 21.5 22.2 22.4 23.1 24.5 25.7 28.5 34.6 38.5 43.0 55.6 71.3 77.8arrow_forwardBusinessarrow_forwardhttps://www.hawkeslearning.com/Statistics/dbs2/datasets.htmlarrow_forward
arrow_back_ios
SEE MORE QUESTIONS
arrow_forward_ios
Recommended textbooks for you
 Glencoe Algebra 1, Student Edition, 9780079039897...AlgebraISBN:9780079039897Author:CarterPublisher:McGraw Hill
 Big Ideas Math A Bridge To Success Algebra 1: Stu...AlgebraISBN:9781680331141Author:HOUGHTON MIFFLIN HARCOURTPublisher:Houghton Mifflin Harcourt
 College Algebra (MindTap Course List)AlgebraISBN:9781305652231Author:R. David Gustafson, Jeff HughesPublisher:Cengage Learning
 Holt Mcdougal Larson Pre-algebra: Student Edition...AlgebraISBN:9780547587776Author:HOLT MCDOUGALPublisher:HOLT MCDOUGAL
Glencoe Algebra 1, Student Edition, 9780079039897...
Algebra
ISBN:9780079039897
Author:Carter
Publisher:McGraw Hill
Big Ideas Math A Bridge To Success Algebra 1: Stu...
Algebra
ISBN:9781680331141
Author:HOUGHTON MIFFLIN HARCOURT
Publisher:Houghton Mifflin Harcourt
College Algebra (MindTap Course List)
Algebra
ISBN:9781305652231
Author:R. David Gustafson, Jeff Hughes
Publisher:Cengage Learning
Holt Mcdougal Larson Pre-algebra: Student Edition...
Algebra
ISBN:9780547587776
Author:HOLT MCDOUGAL
Publisher:HOLT MCDOUGAL
Statistics 4.1 Point Estimators; Author: Dr. Jack L. Jackson II;https://www.youtube.com/watch?v=2MrI0J8XCEE;License: Standard YouTube License, CC-BY
Statistics 101: Point Estimators; Author: Brandon Foltz;https://www.youtube.com/watch?v=4v41z3HwLaM;License: Standard YouTube License, CC-BY
Central limit theorem; Author: 365 Data Science;https://www.youtube.com/watch?v=b5xQmk9veZ4;License: Standard YouTube License, CC-BY
Point Estimate Definition & Example; Author: Prof. Essa;https://www.youtube.com/watch?v=OTVwtvQmSn0;License: Standard Youtube License
Point Estimation; Author: Vamsidhar Ambatipudi;https://www.youtube.com/watch?v=flqhlM2bZWc;License: Standard Youtube License