
Videos
The bar graph indicates that fewer U.S. adults are getting married.
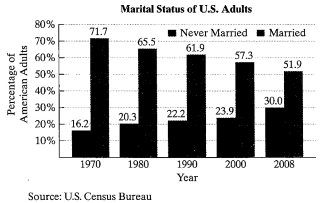
The data can be modeled by the following system of linear equations:
Percentage of never-married American adults, y, x years after 1970
Percentage of married American adults, y, x years after 1970
a. Use these models to determine the year, rounded to the nearest year, when the percentage of never-married adults will be the same as the percentage of married adults. For that year, approximately what percentage of Americans, rounded to the nearest percent, will belong to each group?
b. How is your approximate solution from part (a) shown by the following graphs?
Want to see the full answer?
Check out a sample textbook solution
Chapter 8 Solutions
Algebra and Trigonometry


- Solve by the quadratic formula or completing the square to obtain exact solutions. 2 e 104 OA) -16±3√6 B) 8±√10 O c) -8±√10 OD) 8±3√√6 Uarrow_forwardQuestion 14 (1 point) Listen The frame on a picture is 18 in by 22 in outside and is of uniform width. Using algebraic methods, what is the width of the frame if the inner area of the picture shown is 250 in²2? Write answer to 2 decimal places. (Write the number with no units). 18 in Your Answer: 22 inarrow_forward◄ Listen A vacant lot is being converted into a community garden. The garden and a walkway around its perimeter have an area of 560 square feet. Find the width of the walkway (x) if the garden measures 15 feet wide by 19 feet long. Write answer to 2 decimal places. (Write the number without units). X 15 feet Your Answer: 19 feet Xarrow_forward
- Listen A stuntman jumps from a roof 440 feet from the ground. How long will it take him to reach the ground? Use the formula, distance, d = 16t2, (where t is in seconds). Write answer to 1 decimal place. (Write the number, not the units). Your Answer:arrow_forwardSolve x² - 10x + 24 = 0 ○ A) 4,6 B) -12, -2 C) 12,2 D) -4, -6arrow_forwardc7. = -(9 - x) 25 A a) -1, 11 b) 31 c) 11 d) 1, 11arrow_forward
- 2 4x² - 12x-7=0 A) 7 ON 1,-1 4 OB)-, 7 1 C) 2,2 Oa½½-½ c) 17/17, - 1/1/1 D) 2, 2 ODI-,-arrow_forwardSolve using the quadratic equation formula 4x² + 12x=-6 ○ a) -12±√√3 2 b) -3±√15 -3+√15 2 ○ c) c) -3±√√√3 2 d) -3±√3 8arrow_forwardListen Solve the quadratic equation by factoring. One solution is 0. Find the other. 2x² + 16x = 0 Your Answer: Answerarrow_forward
 Elementary AlgebraAlgebraISBN:9780998625713Author:Lynn Marecek, MaryAnne Anthony-SmithPublisher:OpenStax - Rice University
 Holt Mcdougal Larson Pre-algebra: Student Edition...AlgebraISBN:9780547587776Author:HOLT MCDOUGALPublisher:HOLT MCDOUGAL

 Functions and Change: A Modeling Approach to Coll...AlgebraISBN:9781337111348Author:Bruce Crauder, Benny Evans, Alan NoellPublisher:Cengage Learning
 College Algebra (MindTap Course List)AlgebraISBN:9781305652231Author:R. David Gustafson, Jeff HughesPublisher:Cengage Learning