
Concept explainers
Videos
The graphs show the percentage of American adults in two living arrangements from 1960 through 2008.
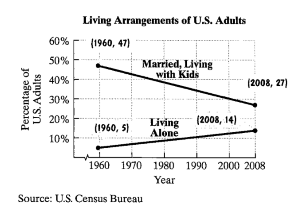
a. Write the slope-intercept equation of the line that models the percentage of U.S. adults living alone, y, x years after 1960. Round the value of the slope, m, to one decimal place.
b. Write the slope-intercept equation of the line that models the percentage of married U.S. adults living with kids, y, x years after 1960. Round the value of the slope, m, to one decimal place.
c. Use the models from parts (a) and (b) to project the year in which the percentage of adults living alone will be the same as the percentage of married adults living with kids. What percentage of U.S. adults will belong to each group during that year?
Want to see the full answer?
Check out a sample textbook solution
Chapter 8 Solutions
Algebra and Trigonometry


- Problem #3 If a card is picked at random from a standard 52-card deck, what is the probability of getting a black card or a queen?arrow_forwardProblem #1 In the 2010 census, it was reported that the United States had a population of 310 million people. Of those, 74 million were under the age of 18. If you chose a person from the U.S. population at random, what is the probability they are under the age of 18? Problem #2 Given a set S={1, 2, 3, 4, 5, 6, 7, 8, 9, 10}, if you were choosing a number at random what is the probability that you would choose an even number or a number larger than 7?arrow_forwardComplete the table below. For solutions, round to the nearest whole number.arrow_forward
- Let the universal set be whole numbers 1 through 20 inclusive. That is, U = {1, 2, 3, 4, . . ., 19, 20}. Let A, B, and C be subsets of U. Let A be the set of all prime numbers: A = {2, 3, 5, 7, 11, 13, 17, 19} Let B be the set of all odd numbers: B = {1,3,5,7, . . ., 17, 19} Let C be the set of all square numbers: C = {1,4,9,16}arrow_forwardA research team consists of 4 senior researchers and 10 research assistants. The team needs to select 2 senior researchers and 2 research assistants to attend a conference. How many different ways can the group being sent to the conference be formed?arrow_forwardThere are 25 different varieties of flowering plants found in a natural habitat you are studying. You are asked to randomly select 5 of these flowering plant varieties to bring back to your laboratory for further study. How many different combinations of are possible? That is, how many possible 5 plant subgroups can be formed out of the 25 total plants found?arrow_forward
- A person is tossing a fair, two-sided coin three times and recording the results (either a Heads, H, or a Tails, T). Let E be the event that exactly two heads are tossed. Which of the following sets represent the event E? Group of answer choices {HHT, HTH, THH} {HHT, THH} {HHH, HHT, HTH, THH, TTT, TTH, THT, HTT} {HH}arrow_forwardTake Quiz 54m Exit Let the universal set be whole numbers 1 through 20 inclusive. That is, U = {1, 2, 3, 4, . . ., 19, 20}. Let A, B, and C be subsets of U. Let A be the set of all prime numbers: A = {2, 3, 5, 7, 11, 13, 17, 19} Let B be the set of all odd numbers: B = {1,3,5,7, • • , 17, 19} Let C be the set of all square numbers: C = {1,4,9,16} ☐ Question 2 3 pts Which of the following statement(s) is true? Select all that apply. (1) АСВ (2) A and C are disjoint (mutually exclusive) sets. (3) |B| = n(B) = 10 (4) All of the elements in AC are even numbers. ☐ Statement 1 is true. Statement 2 is true. Statement 3 is true. Statement 4 is true.arrow_forward☐ Question 1 2 pts Let G be the set that represents all whole numbers between 5 and 12 exclusive. Which of the following is set G in standard set notation. (Roster Method)? O G = [5, 12] G = {5, 6, 7, 8, 9, 10, 11, 12} O G = (5, 12) OG = {6, 7, 8, 9, 10, 11}arrow_forward
- Solve thisarrow_forwardint/PlayerHomework.aspx?homeworkId=689099898&questionId=1&flushed=false&cid=8120746¢erw BP Physical Geograph... HW Score: 0%, 0 of 13 points ○ Points: 0 of 1 Determine if the values of the variables listed are solutions of the system of equations. 2x - y = 4 3x+5y= - 6 x=1, y = 2; (1,-2) Is (1, 2) a solution of the system of equations? L No Yes iew an example Get more help - Aarrow_forward12:01 PM Tue May 13 < AA ✓ Educatic S s3.amazona... A Assess Your... 目 accelerate-iu15-bssd.vschool.com S s3.amazona... Trigonometric Identities Module Exam Dashboard ... Dashboard ... Algebra 2 Pa... Algebra 2 Part 4 [Honors] (Acc. Ed.) (Zimmerman) 24-25 / Module 11: Trigonometric Identities i + 38% ✰ Start Page Alexis Forsythe All changes saved 10. A sound wave's amplitude can be modeled by the function y = −7 sin ((x-1) + 4). Within the interval 0 < x < 12, when does the function have an amplitude of 4? (Select all that apply.) 9.522 seconds 4.199 seconds 0.522 seconds 1.199 seconds Previous 10 of 20 Nextarrow_forward
 Holt Mcdougal Larson Pre-algebra: Student Edition...AlgebraISBN:9780547587776Author:HOLT MCDOUGALPublisher:HOLT MCDOUGAL
 Glencoe Algebra 1, Student Edition, 9780079039897...AlgebraISBN:9780079039897Author:CarterPublisher:McGraw Hill
 Algebra: Structure And Method, Book 1AlgebraISBN:9780395977224Author:Richard G. Brown, Mary P. Dolciani, Robert H. Sorgenfrey, William L. ColePublisher:McDougal Littell
 Big Ideas Math A Bridge To Success Algebra 1: Stu...AlgebraISBN:9781680331141Author:HOUGHTON MIFFLIN HARCOURTPublisher:Houghton Mifflin Harcourt
 College Algebra (MindTap Course List)AlgebraISBN:9781305652231Author:R. David Gustafson, Jeff HughesPublisher:Cengage Learning