
PRIN.OF CORPORATE FINANCE
13th Edition
ISBN: 9781260013900
Author: BREALEY
Publisher: RENT MCG
expand_more
expand_more
format_list_bulleted
Videos
Textbook Question
Chapter 8, Problem 7PS
Portfolio risk and return* Here are returns and standard deviations for four investments.
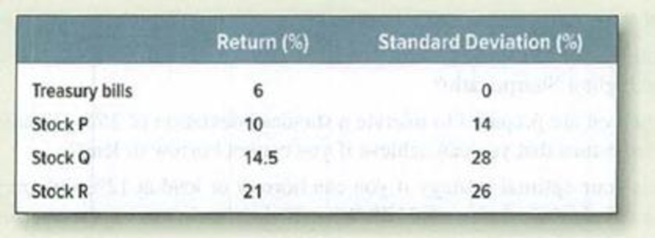
Calculate the standard deviations of (the following portfolios.
- a. 50% in Treasury bills, 50% in stock P.
- b. 50% each in Q and R, assuming the shares have
- • Perfect positive correlation.
- • Perfect negative correlation.
- • No correlation.
- c. Plot a figure like Figure 8.3 for Q and R, assuming a correlation coefficient of .5.
- d. Stock Q has a lower return than R but a higher standard deviation. Does that mean that Q’s price is too high or that R’s price is too low?
Expert Solution & Answer
Want to see the full answer?
Check out a sample textbook solution
Students have asked these similar questions
Suppose a portfolio is given as follows:
Investment
Name
ABC Corn Mill
X-Treme
Manufacturing
b.) 3.6%
Ob.) none listed
a.) none listed
a.) 4.5%
a.) 4%
b.) 4%
b.) 3.4%
Weight
a.) 5%
0.4
0.6
a.) What is the expected return of the portfolio?
b.) What is the standard deviation of the portfolio if the correlation is +0.4?
Select the most appropriate responses below for parts a.) and b.).
Expected Return
2%
7%
Standard
Deviation
2%
5%
QG. The following information is available about the stocks of two companies A and B:
Stock A Stock B
Expected Return (%)
Probability
-5
12
15
20
0.05
0.55
0.35
0.05
Expected Return (%)
Probability
5
15
18
20
0.05
0.65
0.20
0.10
Stock
Standard Deviation of Returns (%)
A
B
25
35
The coefficient of correlation between the returns on A and B is 0.05. A portfolio is constructed by allocating the funds between A and B in the ratio of 2:3.
Calculate the expected return on the portfolio. b. Calculate the portfolio risk.
In-class Example 4: Portfolio Risk Return
Suppose that a portfolio of stocks has an expected return E(rS) = 12% and a standard deviation of returns sS = 20%. A portfolio of corporate bonds has an expected return E(rB) = 6% and a standard deviation sB = 9%.
a) What is the expected portfolio return and portfolio standard deviation for an equally weighted combination of the stock and bond portfolio if the correlation between stock and bond portfolio returns, rSB, is -0.5?
b) Suppose you require a portfolio expected return of 15% per year. What weights must you assign to the stock and bond portfolios to achieve this expected return? What is the standard deviation of returns for this combination portfolio if the correlation between stock and bond returns is -0.5?
C) Suppose that the standard deviation of the market (sM) is 15% and the correlation between the stock portfolio and the market is 0.7. What is the beta of the stock portfolio?
Chapter 8 Solutions
PRIN.OF CORPORATE FINANCE
Ch. 8 - Efficient portfolios For each of the following...Ch. 8 - Efficient portfolios Figure 8.11 purports to show...Ch. 8 - Portfolio risk and return Look back at the...Ch. 8 - Portfolio risk and return Mark Harrywitz proposes...Ch. 8 - Portfolio risk and return Ebenezer Scrooge has...Ch. 8 - Portfolio risk and return Here are returns and...Ch. 8 - Portfolio risk and return Percival Hygiene has IO...Ch. 8 - Sharpe ratio Use the long-term data on security...Ch. 8 - Portfolio beta Refer to Table 7.5. a. What is the...Ch. 8 - CAPM True or false? Explain or qualify as...
Ch. 8 - CAPM True or false? a. The CAPM implies that if...Ch. 8 - CAPM Suppose that the Treasury bill rate is 6%...Ch. 8 - CAPM The Treasury bill rate is 4%, and the...Ch. 8 - Cost of capital Epsilon Corp. is evaluating an...Ch. 8 - APT Consider a three-factor APT model. The factors...Ch. 8 - Prob. 18PSCh. 8 - APT Consider the following simplified APT model:...Ch. 8 - Prob. 20PSCh. 8 - Three-factor modelThe following table shows the...Ch. 8 - Efficient portfolios Look again at the set of the...
Knowledge Booster


Learn more about
Need a deep-dive on the concept behind this application? Look no further. Learn more about this topic, finance and related others by exploring similar questions and additional content below.Similar questions
- 4. Suppose that we have three stocks with the following parameter values. Expected Standard Correlations of Returns Return Deviation Stock 1 Stock 2 Stock 3 Stock 1 0.20 0.25 1.00 0.30 0.40 Stock 2 0.25 0.35 1.00 0.60 Stock 3 0.15 0.15 1.00 (a) Find the expected return and standard deviation of a portfolio with 25% in stock 1, 50% in stock 2, and 25% in stock 3. Show your steps. (b) For the portfolio in part (a), find the covariance of its return with the return of the equally weighted portfolio of stock 1 and stock 2. (Equal weighting for a two-asset portfolio means that the weights are 50% and 50%.) Show your steps. (c) Someone claims that the portfolio in part (a) is the tangency portfolio of these three stocks. (Note that the concept of the tangency portfolio was explained in Class 5.) Do you believe this claim? Justify your answer. Hint: It may be useful to compare the portfolio in part (a) to a portfolio with somewhat different weights.arrow_forwardAn investiment portfolio consists of two securities, X and Y. The weight of X is 30%. Asset X's expected return is 15% and the standard deviation is 28%. Asset Y's expected return is 23% and the standard deviation is 33%. Assume the correlation coefficient between X and Y is 0.37. A. Calcualte the expected return of the portfolio. B. Calculate the standard deviation of the portfolio return. C. Suppose now the investor decides to add some risk free assets into this portfolio. The new weights of X, Y and risk free assets are 0.21, 0.49 and 0.30. What is the standard deviation of the new portfolio?arrow_forwardConsider a portfolio consisting of the following three stocks: an expected return of 8%. The risk-free rate is 3%. a. Compute the beta and expected return of each stock. ▪ The volatility of the market portfolio is 10% and it has b. Using your answer from part a, calculate the expected return of the portfolio. c. What is the beta of the portfolio? d. Using your answer from part c, calculate the expected return of the portfolio and verify that it matches your answer to part b.arrow_forward
- From the following information, calculate covariance between stocks A and B and expected return and risk of a portfolio in which A and B are equally weighted.Which stock would be recommend if investment in individual stock is to be made? Justify answer using numerical calculations. Stock A Stock B Expected return 24% 35% Standard deviation 12% 18% Coefficient of correlation 0.65 0.65arrow_forwardExpected return of a portfolio using beta. The beta of four stocks—P, Q, R, and S—are 0.49, 0.81, 1.19, and 1.53, respectively and the beta of portfolio 1 is 1.01, the beta of portfolio 2 is 0.86, and the beta of portfolio 3 is 1.15. What are the expected returns of each of the four individual assets and the three portfolios if the current SML is plotted with an intercept of 4.5% (risk-free rate) and a market premium of 12.0% (slope of the line)? What is the expected return of stock P? (Round to two decimal places.) What is the expected return of stock Q? (Round to two decimal places.) What is the expected return of stock R? (Round to two decimal places.) What is the expected return of stock S? (Round to two decimal places.) What is the expected return of portfolio 1? (Round to two decimal places.) What is the expected return of portfolio 2? (Round to two decimal places.) What is the expected return of portfolio 3?…arrow_forwardExpected return of a portfolio using beta. The beta of four stocks—G, H, I, and J—are 0.44, 0.75, 1.21, and 1.55, respectively and the beta of portfolio 1 is 0.99, the beta of portfolio 2 is 0.83, and the beta of portfolio 3 is 1.14. What are the expected returns of each of the four individual assets and the three portfolios if the current SML is plotted with an intercept of 3.5% (risk-free rate) and a market premium of 10.0% (slope of the line) What is the expected return of portfolio 1? (Round to two decimal places.) What is the expected return of portfolio 2? (Round to two decimal places.) What is the expected return of portfolio 3? (Round to two decimal places.)arrow_forward
- Expected return of a portfolio using beta. The beta of four stocks—G, H, I, and J—are 0.44, 0.75, 1.21, and 1.55, respectively and the beta of portfolio 1 is 0.99, the beta of portfolio 2 is 0.83, and the beta of portfolio 3 is 1.14. What are the expected returns of each of the four individual assets and the three portfolios if the current SML is plotted with an intercept of 3.5% (risk-free rate) and a market premium of 10.0% (slope of the line)? What is the expected return of stock G? (Round to two decimal places.) What is the expected return of stock H? (Round to two decimal places.) What is the expected return of stock I? (Round to two decimal places.) What is the expected return of stock J? (Round to two decimal places.) What is the expected return of portfolio 1? (Round to two decimal places.) What is the expected return of portfolio 2? (Round to two decimal places.) What is the expected return of portfolio 3?…arrow_forwardThe securities of firms A and B have the expected return and standard deviations given below. The expected correlation between the two stocks is 0.1 (see the attached picture) Calculate the return and risk for each of the following portfolios: 100% A 100% B 60% A - 40% B 50% A - 50% Barrow_forwardCalculate the standard deviation of a portfolio with 0.24 invested in Asset A, 0.33 invested in Asset B, and the rest invested in Asset C. Express your answer as a decimal with four digits after the decimal point (e.g., 0.1234, not 12,34%). Std Dev(A) = 0.43, Std Devirg) = 0.67. Std Dev(rc)=0.53 Correlation(A) =-0.24, Correlation(Arc)-0.32, Correlationirere)=0.09 Type your answer.....arrow_forward
- Consider an investment portfolio that consists of three different stocks, with the amount invested in each asset shownbelow. Assume the risk-free rate is 2.5% and the market risk premium is 6%. Use this information to answer thefollowing questions.Stock Weights BetasChesapeake Energy 25% 0.8Sodastream 50% 1.3Pentair 25% 1.0a) Compute the expected return for each stock using the CAPM and assuming that the stocks are all fairly priced.b) Compute the portfolio beta and the expected return on the portfolio.c) Now assume that the portfolio only includes 50% invested in Pentair and 50% invested in Sodastream (i.e., a twoassetportfolio). The yearly-return standard deviation of Pentair is 48% and the yearly-return standard deviation ofSodastream is 60%. The correlation coefficent between Pentair’s returns and Sodastream’s returns is 0.3 What is theexpected yearly-return standard deviation for this portfolio?arrow_forwardConsider a portfolio consisting of the following three stocks: E The volatility of the market portfolio is 10% and it has an expected return of 8%. The risk-free rate is 3%. a. Compute the beta and expected return of each stock. b. Using your answer from part (a), calculate the expected return of the portfolio. c. What is the beta of the portfolio? d. Using your answer from part (c), calculate the expected return of the portfolio and verify that it matches your answer to part (b). a. Compute the beta and expected return of each stock. (Round to two decimal places.) TITLT Data table Portfolio Weight (A) Volatility (B) Correlation (C) Expected Return (E) % Beta (D) НЕС Согр 0.28 13% 0.33 Green Widget (Click on the following icon a in order to copy its contents into a spreadsheet.) 0.39 27% 0.61 % Portfolio Weight Alive And Well 0.33 14% 0.43 Volatility 13% Correlation with the Market Portfolio НЕС Согр Green Widget 0.28 0.33 b. Using your answer from part (a), calculate the expected…arrow_forwardAssume the risk-free rate is r = 3%. Consider the data in the table below: Stock Expected Return Volatility Stock 1 15% 40% Stock 2 7% 30% acompute (c) Determine the tangent portfolios & their respective mean returns and volatilitiesarrow_forward
arrow_back_ios
SEE MORE QUESTIONS
arrow_forward_ios
Recommended textbooks for you
 EBK CONTEMPORARY FINANCIAL MANAGEMENTFinanceISBN:9781337514835Author:MOYERPublisher:CENGAGE LEARNING - CONSIGNMENT
EBK CONTEMPORARY FINANCIAL MANAGEMENT
Finance
ISBN:9781337514835
Author:MOYER
Publisher:CENGAGE LEARNING - CONSIGNMENT
Investing For Beginners (Stock Market); Author: Daniel Pronk;https://www.youtube.com/watch?v=6Jkdpgc407M;License: Standard Youtube License